Figures & data
Figure 1. NJOY VapePen emissions characterization curve for total particulate matter (TPM) concentration, CTPM (mg/mL) as a function of puff flow rate, qpuff (mL/s) and duration, dpuff (s).
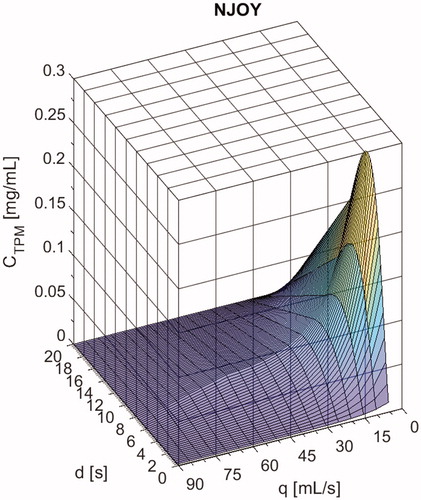
Figure 2. NJOY VapePen topography map showing the puff flow rate, qpuff (mL/s), and puff duration, dpuff (s), for every puff taken by thirty-three users of high, medium and low nicotine strength eliquids over the course of 1 week in the natural environment. The marginal cumulative distribution function (mCDF) is plotted in the bottom panel for flow rate and in the left panel for duration. Lines of constant volume (mL) are superimposed on the main panel for puff volumes for mCDF values of 25% (17 mL), 50% (52 mL), 75% (111 mL), and 97.5% (435 mL). The dotted black line represents the topography envelope, drawn to include 95% of puff flow rates, durations, and volumes observed.
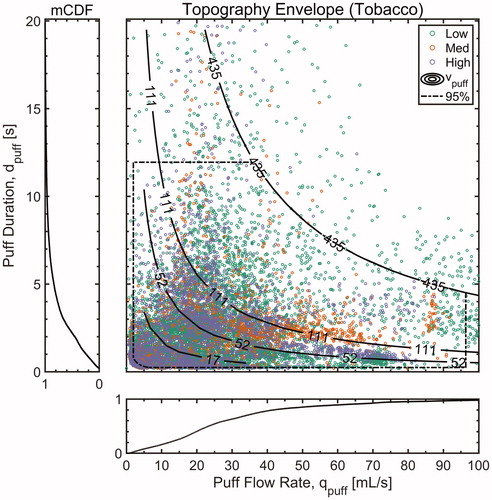
Table 1. Group-wise mean topography, per-puff TPM yield, and per-puff nicotine yield resulting from puff-by-puff analysis.
Figure 3. NJOY VapePen TPM yield map, YTPM (mg/puff), showing the puff flow rate, duration and volume associated with every puff taken by 33 users over the course of 1 week in the natural environment. Constant puff volume lines (mL) are superimposed on the plot and have units of mL. YTPM is contoured by magnitude.
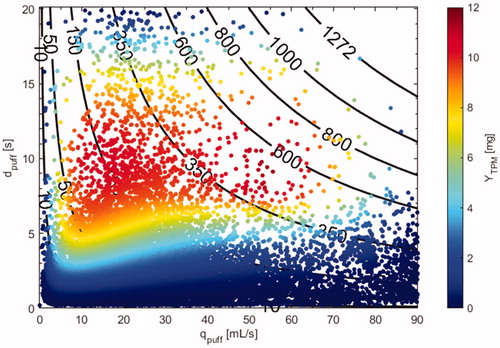
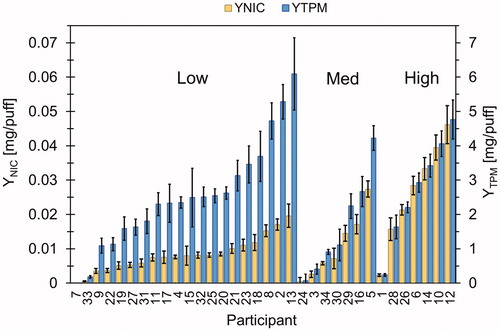
Figure 4. Participant-specific mean yields from puff-by-puff analysis of week-long behavior. Mean nicotine yield per puff, YNIC (mg/puff) is shown on the left axis. Total particulate matter (TPM) yield per puff, YTPM (mg/puff) is shown on the right axis. Data are grouped be nicotine strength users, low, medium, and high, and sorted by magnitude from left to right. Bars are 95% CI on the mean for each participant.