Figures & data
Figure 1. Schematic representation of the five lobes of the human lung. Lung lobes are denoted as left upper lobe (LU), left lower lobe (LL), right upper lobe (RU), right middle lobe (RM), and right lower lobe (RL).
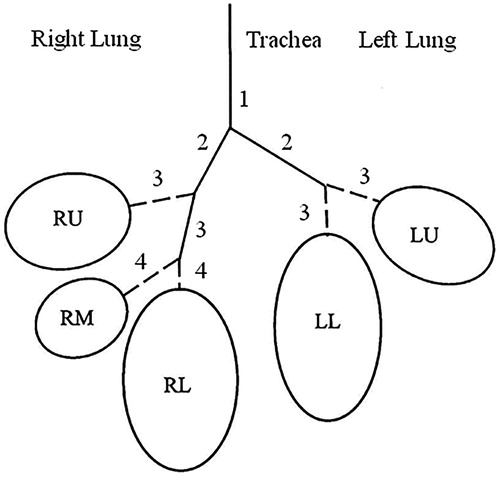
Table 1. Lobar volumes, effective lobar bronchial surface areas, and average number of bronchial airway generations of the five lobes of the human lung, normalized to a Functional Residual Capacity (FRC) of 3300 cm3 (International Commission on Radiological Protection (ICRP) Citation1994).
Figure 2. Distributions of airway diameters (panel A) and lengths (panel B) in generations k = 6 (bronchi) and k = 12 (bronchioles) in the LL lobe (largest volume) and the RM lobe (smallest volume). Median diameters are 8.7 mm (GSD = 1.4) for k = 6 and 6.3 mm (GSD = 2.4) for k = 12 in the LL lobe, and 4.3 mm (GSD = 1.5) for k = 6 and 1.2 mm (GSD = 1.9) for k = 12 in the RM lobe, respectively. Median lengths are 9.8 mm (GSD = 1.1) for k = 6 and 7.4 mm (GSD = 1.8) for k = 12 in the LL lobe, and 8.6 mm (GSD = 1.2) for k = 6 and 2.7 mm (GSD = 1.6) for k = 12 in the RM lobe, respectively. Airway diameters and lengths are based on the morphometric measurements of Raabe et al. (Citation1976) applying a linear scaling factor of 0.84 to represent FRC dimensions.
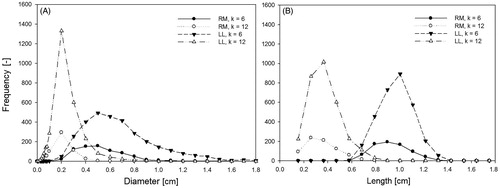
Figure 3. Distributions of the number of intra-lobar bronchial airway generations in the LL lobe (panel A) and RM lobe (panel B). Median generation numbers are 14.1 (GSD = 1.17) in the LL lobe and 12.6 (GSD = 1.18) in the RM lobe.
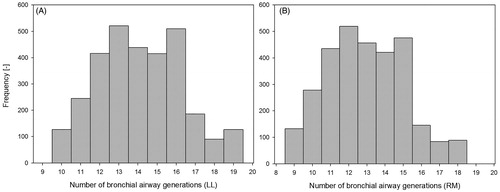
Figure 4. Deposition fractions of unit density particles, ranging from 10 to 10 μm, in the five lobes of the human lung for oral sitting breathing conditions and both uniform (panel A) and non-uniform (panel B) ventilation conditions.
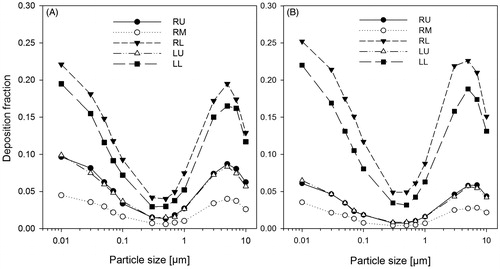
Figure 5. Bronchial (panel A) and alveolar (panel B) deposition fractions of unit density particles, ranging from 10 nm to 10 μm, in the five lobes of the human lung for oral sitting breathing and non-uniform ventilation conditions.
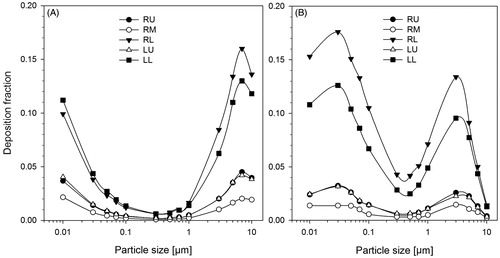
Figure 6. Normalized lobar deposition fractions, i.e. lobar deposition fractions divided by their respective lobar volumes, of unit density particles, ranging from 10 to 10 μm, in the five lobes of the human lung for oral sitting breathing and non-uniform ventilation conditions.
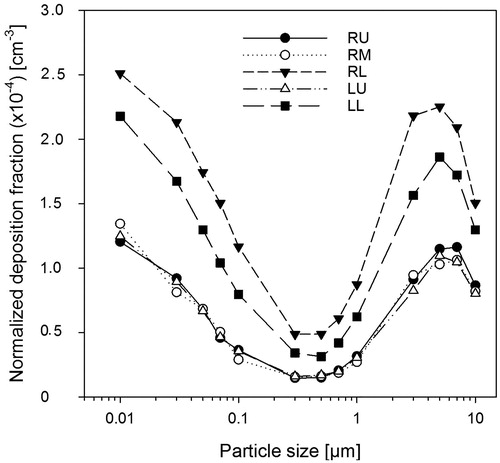
Figure 7. Lobar bronchial deposition densities, i.e. deposition fractions divided by their average effective bronchial airway surfaces within each lobe, of unit density particles, ranging from 10 to 10 μm, in the five lobes of the human lung for oral sitting breathing and non-uniform ventilation conditions.
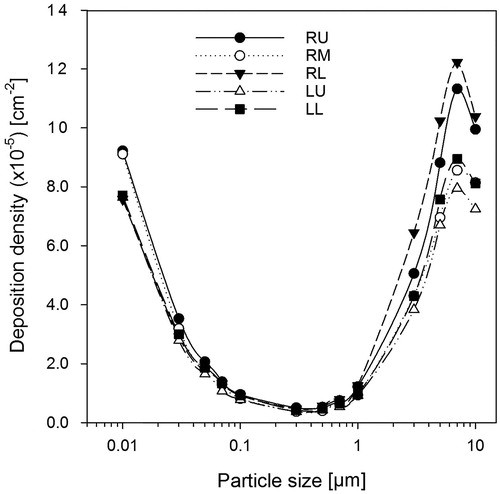
Figure 8. Lobar deposition fractions of 20 nm (panel A), 200 nm (panel B), and 5 µm (panel C) unit density particles for oral sitting breathing and non-uniform ventilation conditions in the five lobes of the human lung for sitting awake (SA), light exercise (LE), and heavy exercise (HE) breathing conditions (International Commission on Radiological Protection (ICRP) Citation1994).
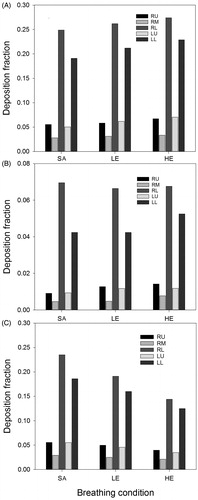
Figure 9. Lobar bronchial deposition fractions of 20 nm (panel A), 200 nm (panel B), and 5 µm (panel C) unit density particles for oral sitting breathing and non-uniform ventilation conditions in the five lobes of the human lung for sitting awake (SA), light exercise (LE), and heavy exercise (HE) breathing conditions (International Commission on Radiological Protection (ICRP) Citation1994).
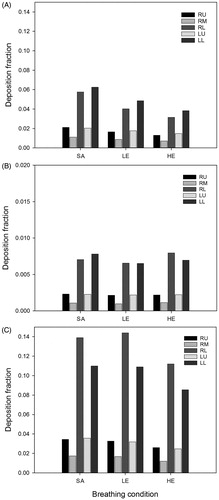
Figure 10. Deposition fractions of 20, 200, and 5 µm unit density particles for oral sitting breathing and non-uniform ventilation conditions among bronchial and alveolar airway generations within different lobes.
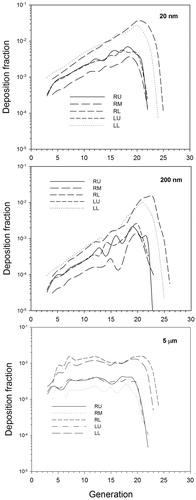
Figure 11. Variability of lobar bronchial deposition fractions for 20, 200, and 5 unit density particles for oral sitting breathing and non-uniform ventilation conditions in the RL lobe (left panels) and RM lobe (right panels).
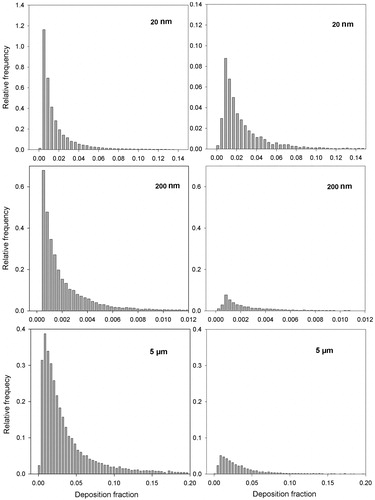
Figure 12. Deposition densities of 20, 200, and 5 µm unit density particles for oral sitting breathing and non-uniform ventilation conditions among bronchial airway generations in the five lobes of the human lung.
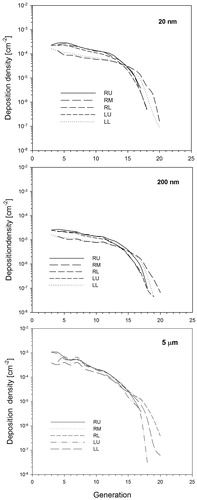
Table 2. Dependence of lobe-specific deposition weighting factors on particle diameter for the five lobes of the human for non-uniform ventilation conditions and oral sitting breathing conditions.
Table 3. Dependence of lobe-specific deposition weighting factors for 20 nm, 200 nm, and 5 μm particles on physical activity or flow rate for sitting awake (Q = 300 cm3 s−1), light (Q = 833.3 cm3 s−1), and heavy exercise (Q = 1672.2 cm3 s−1) and non-uniform ventilation conditions.
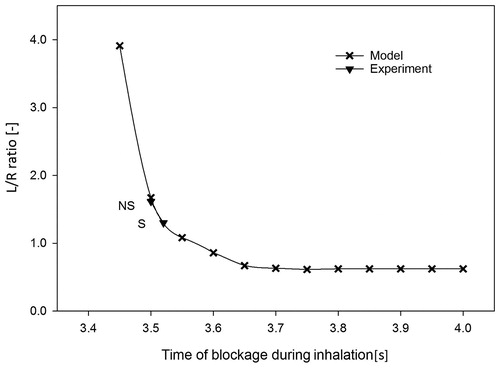
Figure 13. Dependence of the left-to-right (L/R) lung deposition ratio of 100 nm 99mTc labeled carbon particles, delivered as a 100 mL bolus (0.4 s) to a shallow bolus front depth of 150 mL (VT = 1000 mL), i.e. inhaled at 3.4 s, on the blockage time to the right lung for an inhalation time of 4 s. Experimental L/R ratios for nonsmokers (NS) and smokers (S), normalized to the volumetric ratio of 0.85, are included for comparison (Möller et al. Citation2009).