Figures & data
Figure 1. Nose-only inhalation exposure system. Al2O3 NPs aggregates suspension in water and HClg bottle were connected to the system on two parallel paths that joined to create the mixture. Mass flow meters allowed to generate and calibrate the air flow in order to avoid re-inhalation phenomena of the air exhaled by the animals (dynamic air circulation, 10 L/min). During exposures, rats were placed in individual containment tubes positioned on the oro-nasal inhalation tower. Al2O3 NPs and HClg mixture reached the inhalation chamber at a flow rate of 20 L/min. Bubblers and samplers connected to the inhalation tower allowed the collection of samples during the exposures in order to characterize the generated aerosol. A release neutralization system (bubbler with soda and desiccant) was set up at the inhalation tower exit.
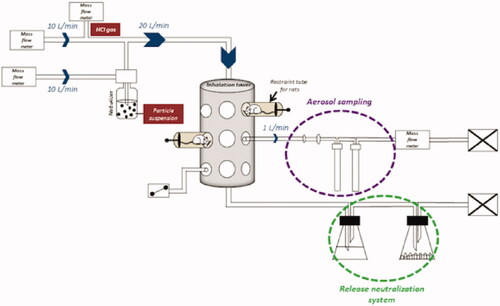
Table 1. Novotec scoring and corresponding pulmonary lesions.
Figure 2. Bulk powder and aerosols alumina nanoparticles physico-chemical characterization. Transmission electron microscopy (TEM) images of Al2O3 NPs in bulk powder (A) and generated aerosol (C) (respective scale bars = 200 nm and 500 nm). Crystalline phases (γ and δ) identification using X-ray diffraction (XRD) on bulk Al2O3 NPs (B). NPs elementary chemical composition (in %) using energy-dispersive X-ray (EDX) spectroscopy on Al2O3 NPs aggregates retrieved in the generated aerosol (D). Table E summarizes Al2O3 NPs representative particles size distribution in the generated aerosols measuring using Sioutas cascade impactor (mg/m3 for each size class in μm).
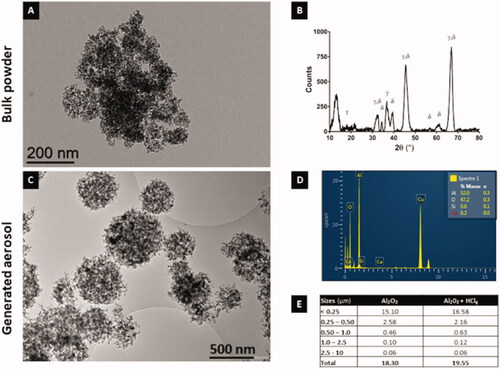
Table 2. Generated aerosols alumina and HClg contents.
Figure 3. Pulmonary aluminum deposition after nose-only exposures. Rats were exposed to air, HClg, Al2O3 or to the mixture Al2O3 + HClg. Clear blue points symbolize single exposures (SE) and dark blue points symbolize repeated exposures (RE) to each aerosol. Mean aluminum quantities (μg/g of lung) ± SD were measured in lungs 24 h after the last exposure using inductively coupled plasma optical emission spectrometry (ICP-OES). One-way ANOVA and Tukey’s post-test (n = 3, ** p-value < 0.01, **** p-value < 0.0001, α risk = 0.05) were performed to compare each experimental condition to the control within the same exposure scenario and Two-way ANOVA and Sidak’s post-test (n = 3, ¤¤¤p-value < 0.001, ¤¤¤¤ p-value < 0.0001, α risk = 0.05) were performed to compare the two exposure scenarios for the same aerosol.
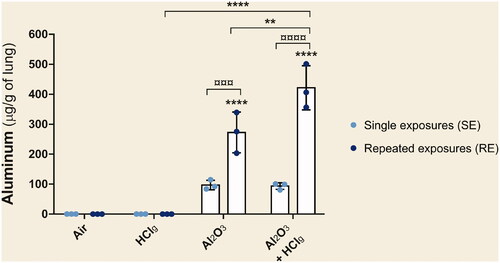
Table 3. Rats body weight changes during the experimental period.
Figure 4. Total proteins, LDH and immune cells populations in bronchoalveolar lavage fluids (BALF). Rats were exposed to air, HClg, Al2O3 or to the mixture Al2O3 + HClg. Clear blue points symbolize single exposures (SE) and dark blue points symbolize repeated exposures (RE) to each aerosol. Total proteins (g/L) (A) and lactate dehydrogenases (LDH, U/L) (B) concentrations were measured in rats BALF 24 h after the last exposure. Total cells, polymorphonuclear neutrophils (PMN), macrophages and lymphocytes (cells × 106) were counted on BALF cytospins (respectively C, D, E, and F). Results are expressed as mean values ± SD. One-way ANOVA and Tukey’s post-test (n = 6, * p-value < 0.05, ** p-value < 0.01, *** p-value < 0.001, **** p-value < 0.0001, α risk = 0.05) were performed to compare each experimental condition to the control within the same exposure scenario and two-way ANOVA and Sidak’s post-test (n = 6, ¤ p-value < 0.05, ¤¤ p-value < 0.01, ¤¤¤ p-value < 0.001, ¤¤¤¤ p-value < 0.0001, α risk = 0.05) were performed to compare the two exposure scenarios for the same aerosol.
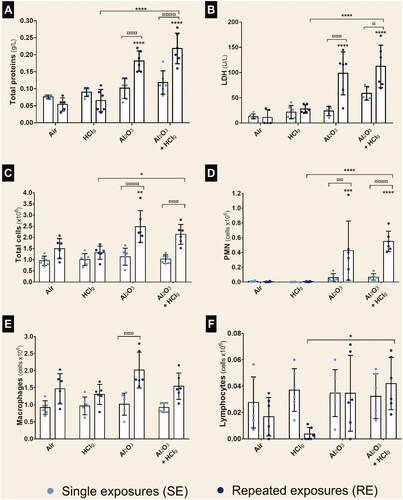
Figure 5. Aerosols pro-inflammatory potential on rat lungs after nose-only inhalations. Rats were exposed to air, HClg, Al2O3 or to the mixture Al2O3 + HClg. Clear blue points symbolize single exposures (SE) and dark blue points symbolize repeated exposures (RE) to each aerosol. Pro-inflammatory cytokines concentrations (pg/mL) of TNF-α (A), IL-1β (B), GRO/KC (C) and MIP-2 (D) were measured in rats BALF 24 h after the last exposure by ELISA multiplex. Results are expressed as mean values ± SD. One-way ANOVA and Tukey’s post-test (n = 6, * p-value < 0.05, ** p-value < 0.01, **** p-value < 0.0001, α risk = 0.05) were performed to compare each experimental condition to the control within the same exposure scenario and two-way ANOVA and Sidak’s post-test (n = 6, ¤¤¤¤ p-value < 0.0001, α risk = 0.05) were performed to compare the two exposure scenarios for the same aerosol.
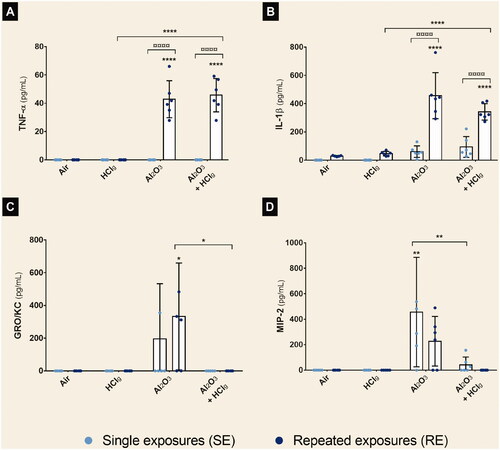
Figure 6. Pulmonary histopathological lesions observations following inhalation exposures. Rats lung parenchyma stained in HPS were observed in optical microscopy for histopathological analysis. Images show, respectively, lung parenchyma 24 h after single exposure (SE) to air (A), HClg (C), Al2O3 (E) and Al2O3 + HClg (G) and 24 h after repeated exposures (RE) to air (B), HClg (D), Al2O3 (F) and Al2O3 + HClg (H). Scale bar = 200 μm. Pictures legends: a = alveoli; b = bronchioles or bronchi; v = blood vessel; c = vascular congestion; blue arrows = vascular edema; red arrows = bronchial (pre)-exfoliation; i = inflammatory area; black squares = velamentous epithelium and black circles = interalveolar septum edema.
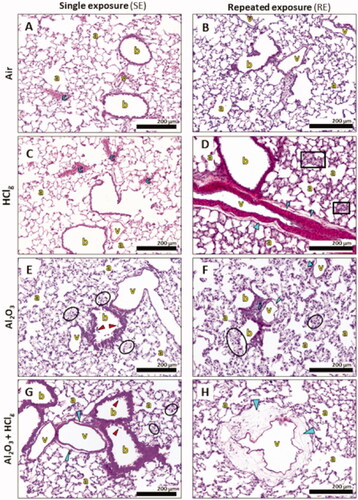
Figure 7. Pulmonary histopathological lesions scoring. Rats were exposed to air, HClg, Al2O3 or to the mixture Al2O3 + HClg. Scoring was performed on HPS stained lungs slices of three rats of each group. Lesion scores (mean ± SD, n = 3) were estimated for each experimental aerosol and exposure scenario based on the presence and the gravity of vascular, alveolar and bronchial lesions observed in rats lungs 24 h after the last exposure. Empty and striped bars represent, respectively, single exposures (SE) and repeated exposures (RE) results.
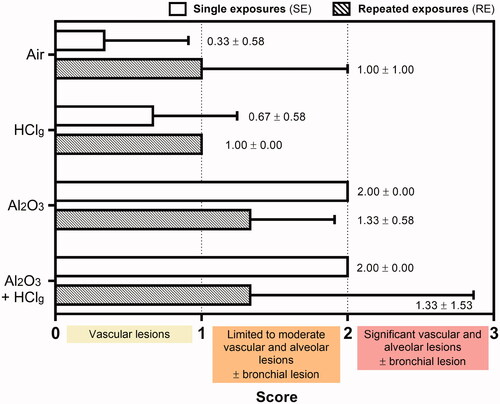
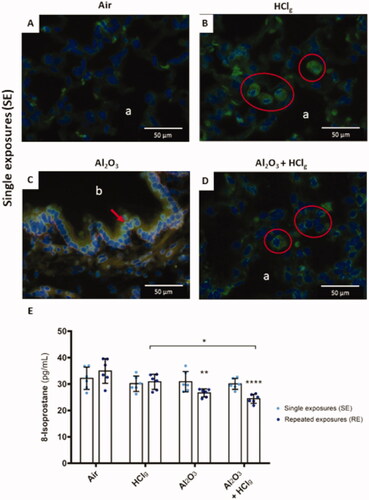
Figure 8. Oxidative stress induction by experimental aerosols inhalation exposures. Immunofluorescence was performed to detect 8-OHdG (8-hydroxy-2'-deoxyguanosine, green fluorescence) on rat lungs slices 24 h after the last exposure. DNA was stained by DAPI, which emits in blue fluorescence. Pictures represent obtained results following single exposures (SE) to air (A), HClg (B), Al2O3 (C) and Al2O3 + HClg (D). Scale bars = 50 μm. Pictures legends: a = alveoli; b = bronchioles or bronchi. Red blood cells could also emit in green fluorescence, but red arrows and red circles point out specific 8-OHdG staining. 8-Isoprostane concentrations (pg/mL) were measured in rats BALF 24 h after the last exposure (E). Clear blue points symbolize single exposures (SE) and dark blue points symbolize repeated exposures (RE) to each aerosol. Results are expressed as mean values ± SD. One-way ANOVA and Tukey’s post-test (n = 3, * p-value < 0.05, ** p-value < 0.01, **** p-value < 0.0001, α risk = 0.05) were performed to compare each experimental condition to the control within the same exposure scenario and two-way ANOVA and Sidak’s post-test (n = 3, α risk = 0.05) were performed to compare the two exposure scenarios for the same aerosol.