Figures & data
Figure 1. Particle generation and exposure setup. The Indium was manually loaded in the modified Technegas generator. After generation, the vacuum pump was started sucking the aerosol into the Mylar balloon. After checking particle sizes via the sampling line, the manual valve was turned, and inhalations started and quantified by the pneumotachograph.
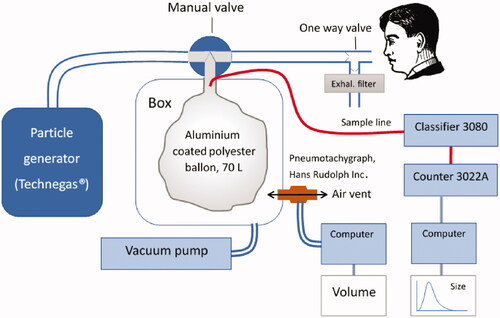
Figure 2. Follow-up protocol after inhalation of an aerosol of ultrafine graphite particles labeled with Indium-111. Activity over the thorax and abdomen were measured in subjects with a large field of view gamma camera. In vitro leaching tests were performed on a filtered sample of the original inhaled aerosol using a dialysis membrane diffusion technique and a sodium iodine well chamber. Blood samples were drawn at every hospital visit and the activity concentration measured in a sodium iodine well counter. Total urine excretion between hospital visits were stored in separate containers and the total excreted activity measure in combination with every visit to the hospital from day 2. Total activity excreted through urine was measured in a sodium iodine well counter.
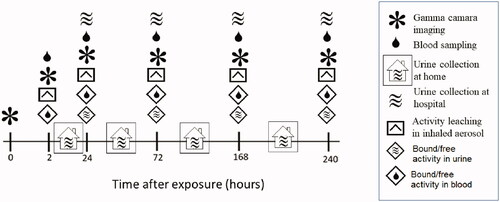
Table 1. Patient clinical characteristics and pulmonary function data.
Table 2. 111In- UFC aerosol characteristics at exposure.
Table 3. Measured time activity distributions for COPD patients.
Table 4. Measured time activity distributions for IPF patients.
Figure 3. Boxplots with the distribution of calculated cumulative pulmonary particle clearance for the group of COPD and IPF patients. Individual values are corrected for activity decay and particle leaching and for comparison interpolated to the same sampling time-points. Whiskers represent the minimum and maximum value of the distribution. Outliers are indicated with the + symbol. Median (interquartile range) cumulative pulmonary clearance at the end of the test period of 10 days were 22.8% (20.8–28.5%) and 25.8% (24.2–31.0%) of inhaled for COPD and IPF, respectively.
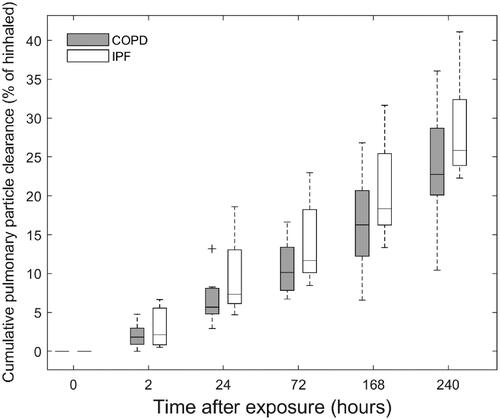
Figure 4. Boxplots with the distribution of bound (panel A) and free (panel B) activity concentrations in blood in COPD and IPF patients. For comparison, the distributions are interpolated to the same sampling time-points for all patients. Whiskers represent the minimum and maximum value of the distribution. Outliers are indicated with the + symbol.
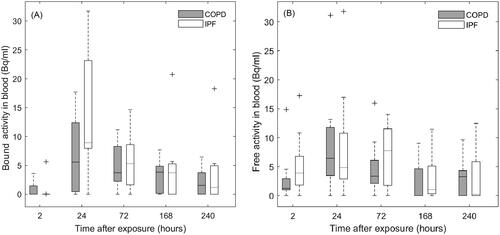
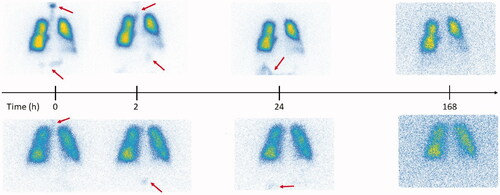
Figure 5. Gamma camera images corresponding to the aerosol follow-up in two representative subjects with high (upper row) and low (lower row) aerosol deposition in the digestive tract after aerosol swallowing during exposure. The arrows indicate regions of activity deposition outside of the lungs after exposure.