
Figures & data
Figure 1. Modifications to the CelTox Sampler through comprehensive iterative testing and optimization stages, indicating the sampling locations for temperature (T), relative humidity (RH) and air flow (q).
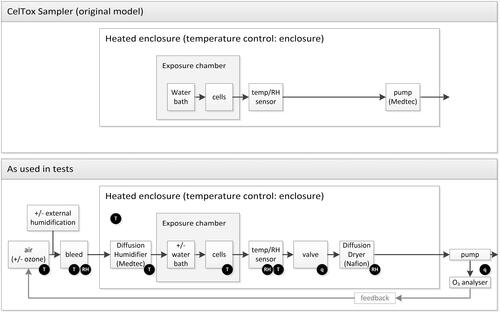
Figure 2. Temperature and relative humidity (RH) in the CelTox Sampler ALI exposure system during a typical cell exposure. (A) Continuous measurements of temperature using an RTD located above a well and a thermohygrometer located downstream of the exposure chamber established the equilibration period and recovery after adding cells. (B) Comparison of relative humidity measurements downstream of the exposure chamber and in-well % RH calculated from downstream dew point. Similar profiles occurred when the water bath was excluded (data not shown). (C) Comparison of temperature monitored at the chamber exhaust using a thermohygrometer to simultaneous measurements directly above the cell insert using a solid-state resistance temperature detector (RTD).
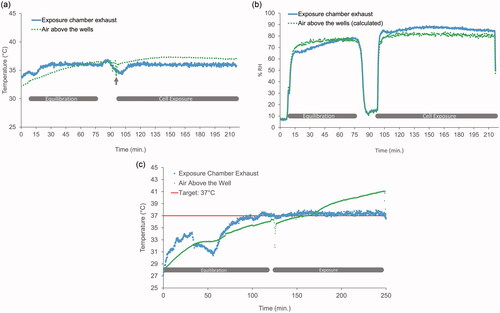
Figure 3. Viability (metabolic activity) of A549 cells exposed to clean air at the ALI for 2 h. Resazurin reduction by A549 cells was measured over 4 h immediately after exposure. “Submerged” refers to cells covered by media rather than cultured at the ALI. Mean values with SEM; n = 3–6 independent experiments are presented. *ALI (clean air) significantly different from the blank control, p < 0.001, two-way ANOVA, Holm-Sidak post-hoc test, with no significant difference between ALI (clean air) and other control groups.
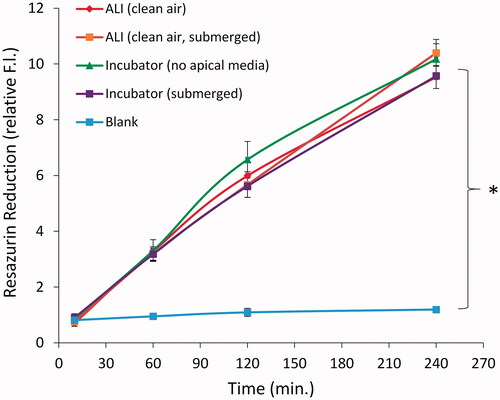
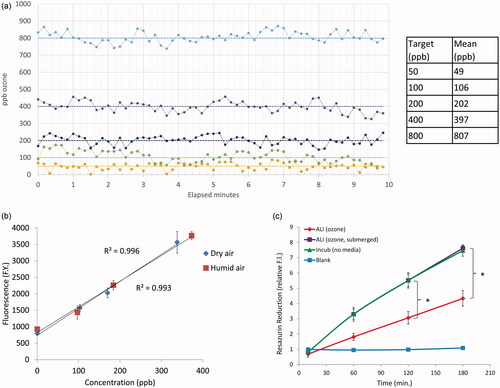
Figure 4. Control of ozone delivery and exposure of A549 cells at the ALI. (A) Ozone levels in the exposure chamber measured at various target concentrations (ppb) over time, using ozone analyzer. (B) Dosimetry of ozone delivered to the cell culture insert, measured using indigo trisulfonate. (C) Viability (metabolic activity) of A549 cells exposed to 200 ppb ozone at the ALI for 2 h, as measured over a 3-hour time period immediately post-exposure. “Submerged” refers to cells covered by media rather than cultured at the ALI; “Incub no media” refers to cells maintained in the incubator with no apical media. Mean values with SEM; n = 4 independent experiments are presented. *ALI (ozone) significantly different from the incubator (no apical media) control, p < 0.05, two-way ANOVA on ranks, Holm-Sidak post-hoc test.