Figures & data
Figure 1. Schematic illustration of the experimental design of the study, including dose-response, collagen analysis and time course studies. The illustration shows the time axis after exposure to ammonia (NH3) via intratracheal instillation (i.t) and the analyses performed at the different time points; 4 h up to 7 days. (BALF: bronchoalveolar lavage fluid).
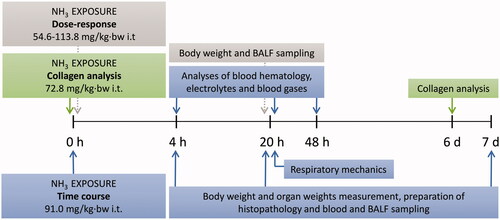
Figure 2. Results from the dose-response study show (A) body weight (BW)-loss, (B) the total number of leukocytes in bronchoalveolar lavage fluid (BALF), and (C) the percentage of neutrophils in BALF at 20 h after exposure to increasing doses of ammonia (NH3) via intratracheal instillation. Scatter plots with means are indicated for each group. One-way analysis of variance (ANOVA), ***p < 0.001 vs. control group.
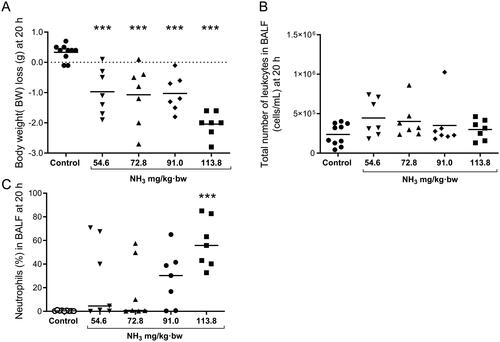
Figure 3. Results from the time course study show (A) body weight (BW)-loss, (B) spleen weights (C) liver weights, and (D) heart weights at 4 h, 20 h and 7 days (% of BW) after exposure to an ammonia (NH3) dose of 91.0 mg/kg·bw via intratracheal instillation and in time-matched controls. Scatter plots with means are indicated for each group. Student’s unpaired t-test, *p < 0.05, **p < 0.01 and ***p < 0.001 between NH3-group and the time-matched control group.
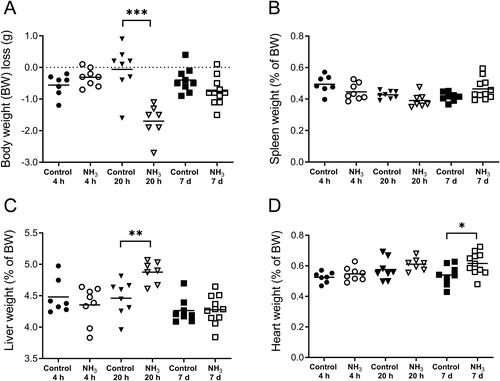
Figure 4. Results from the full-scale study show the total number of (A) leukocytes, (B) macrophages, and (C) neutrophils in bronchoalveolar lavage fluid (BALF) at 4 h, 20 h and 7 days after an ammonia (NH3) dose of 91.0 mg/kg·bw via intratracheal instillation and controls. Scatter plots with means are indicated for each group. Student’s unpaired t-test, *p < 0.05 and **p < 0.01 between NH3-group and the time-matched control group.
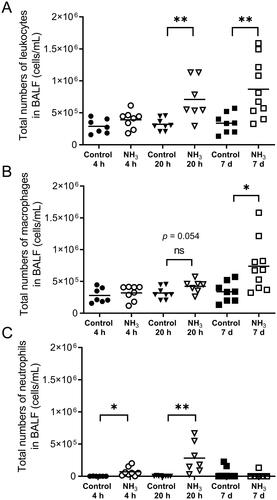
Figure 5. Analyzes of the level of (A) fibrinogen (B) plasminogen activator inhibitor-1 (PAI-1) (C) platelet factor 4 (PF4/CXCL4) (D) endothelin, (E) thrombomodulin, (F) endoglin (G) the receptor for advanced glycation end products (RAGE), and (H) angiopoietin-2 (Ang-2) at 4 h, 20 h and 7 days after exposure to an ammonia (NH3) dose of 91.0 mg/kg·bw via intratracheal instillation and in time-matched controls. Scatter plots with means are indicated for each group. Student’s unpaired t-test, *p < 0.05, **p < 0.01 and ***p < 0.001 between NH3-group and the time-matched control group.
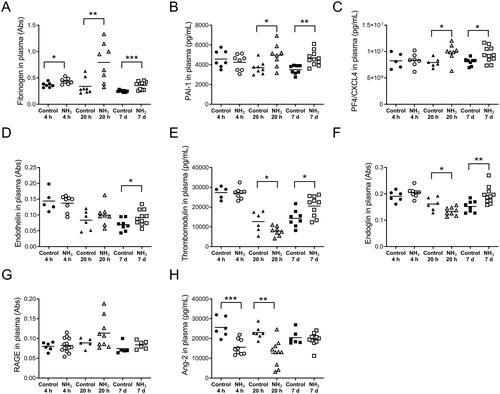
Table 1. Inflammatory mediators in bronchoalveolar lavage fluid (BALF) were measured at 4 hours, 20 hours and 7 days after ammonia (91.0 mg/kg·bw) i.t. instillation exposure.
Table 2. Inflammatory mediators in plasma were measured at 4 hours, 20 hours and 7 days after ammonia (91.0 mg/kg·bw) i.t. instillation exposure.
Table 3. Venous blood is characterized by hematology, chemistry, electrolytes, acid-base, blood gases, lactate and thrombocyte numbers; at 4 hours, 20 hours and 48 hours following exposure to ammonia (91.0 mg/kg·bw) i.t. instillation.
Figure 6. Respiratory mechanics in mice at 20 h after exposure to an ammonia (NH3) dose of 91.0 mg/kg·bw compared to healthy controls. Measurements of methacholine (MCh)-induced (A) respiratory resistance, RRS, (B) Newtonian resistance, RN, (C) tissue resistance, G, (D) respiratory elastance, ERS, and (E) tissue elastance, H, was performed using the Flexivent™. Baseline parameters show data from NH3 exposed animals and control animals recorded without MCh provocation. Values indicate means ± SEM. Two-way analysis of variance (ANOVA) to determine differences between groups followed by Bonferroni post hoc test, *p < 0.05, **p < 0.01 and ***p < 0.001 vs. control group.
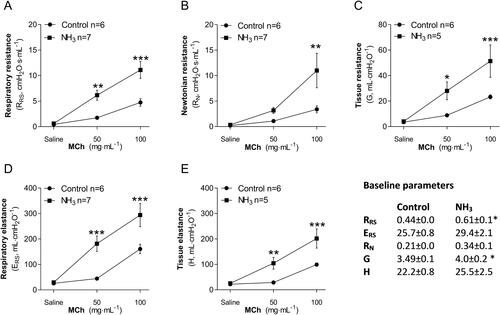
Figure 7. Histopathological evaluation of lung sections from mice exposed to an ammonia dose of 91.0 mg/kg·bw at two different time-points after exposure, 20 h and 7 days, and healthy controls. Photographs show representative bronchial (upper panels) and alveolar areas (lower panels) of the lungs at each time. Sections stained with hematoxylin and eosin and evaluated using light microscopy using 20 and 40x magnification.
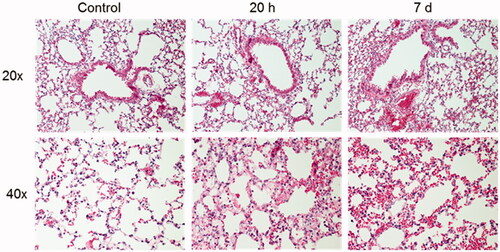
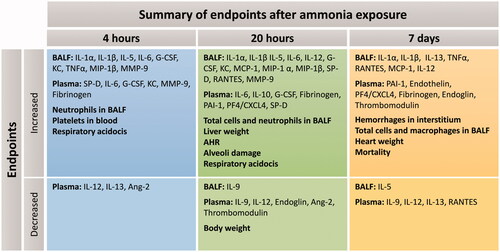
Figure 8. Summary of all results at each time point after exposure to an ammonia dose of 91.0 mg/kg·bw via intratracheal instillation (at 4 h, 20 h and 7 days). The top row (increased) shows induced biomarkers and pathophysiological conditions, and the bottom row (decreased) biomarkers decrease in relation to time-matched control groups. (BALF: bronchoalveolar lavage fluid. AHR: airway hyperresponsiveness).