
Figures & data
Figure 1. Time line for exposure and HRV and PAT registration in all scenarios.
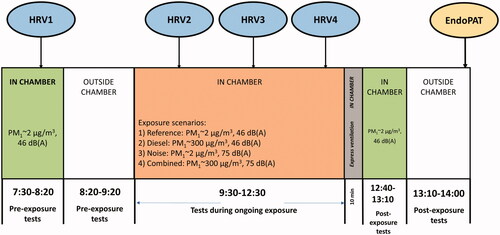
Figure 2. The setup for the chamber exposure studies.
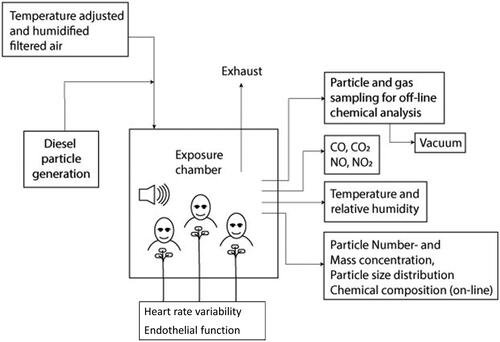
Figure 3. Typical particle number size distribution during the diesel exhaust exposure.
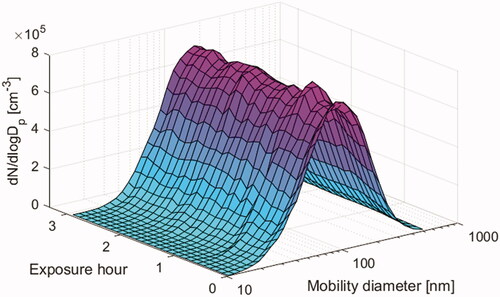
Table 1. Summary of exposure characteristics (mean ± standard deviation) of exposures during each exposure scenario.
Table 2. Descriptive statistics (medians and ranges) of HRV and endothelial function parameters for each exposure scenario.
Table 3. Percentage changes in HRV parameters during the different exposure scenarios compared to the reference exposure.
Table 4. Reactive Hyperemia Index (RHI), Augmentation Index, and baseline pulse amplitudes after the different exposure scenarios compared to the reference exposure, after exclusions (n = 16).