
Figures & data
Table 1. Subject demographics.
Figure 1. Sputum inflammatory response to WSP of the entire cohort.
Sputum % PMN (Panel A), PMN/mg sputum (Panel B), IL-1β (Panel C), IL-6 (Panel D), IL-8 (Panel E) and TNFα (Panel F) at baseline, 6- and 24-hours post WSP challenge in the total unstratified cohort. Asterisk denotes mixed model analysis using a compound symmetry covariance matrix where fit used Restricted Maximum Likelihood (REML) to allow for overall and multiple comparisons and missing data.
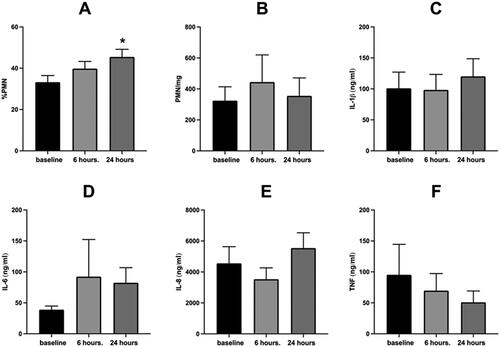
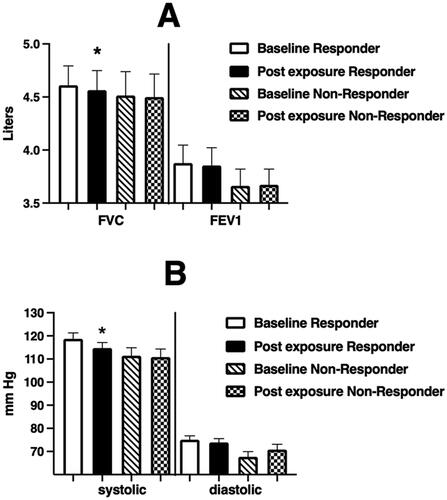
Figure 2. Spirometric and blood pressure endpoints at baseline and immediately after WSP challenge of the entire unstratified cohort.
Spirometric and blood pressure endpoints at baseline and immediately after WSP challenge in the total unstratified cohort. Asterisk denotes paired t-test.
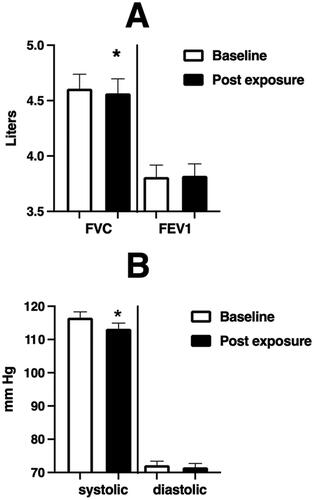
Table 2. Correlative analysis for inflammatory biomarkers.
Table 3. Systemic Endpoints of the Entire Cohort at 6 and 24 hours Post WSP Exposure.
Figure 3. Sputum Inflammatory Response to WSP of responsive volunteers as defined by %PMNs at 6 hours.
Sputum % PMN (Panel A), PMN/mg sputum (Panel B), IL-1β (Panel C), IL-6 (Panel D), IL-8 (Panel E) and TNFα (Panel F) at baseline, 6- and 24-hours post WSP challenge in the cohort of volunteers responsive to WSP based on a change from baseline of the 6-hour %PMN of at least 10% (N = 30). Asterisk denotes mixed model analysis using a compound symmetry covariance matrix where fit used Restricted Maximum Likelihood (REML) to allow for overall and multiple comparisons and missing data.
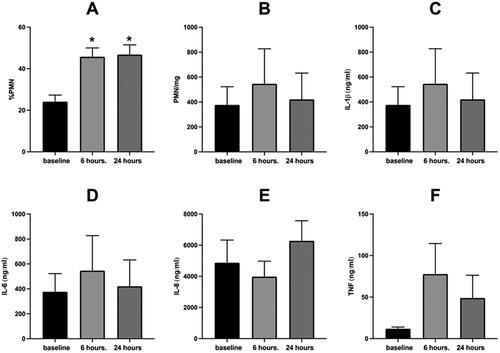
Figure 4. Spirometric (Panel A) and blood pressure (Panel B) endpoints at baseline and immediately after WSP challenge of responsive volunteers as defined by %PMNs at 6 hours.
Spirometric and blood pressure endpoints at baseline and immediately after WSP challenge in responders and non-responders defined at 6 hours. Asterisk denotes paired t-test test.
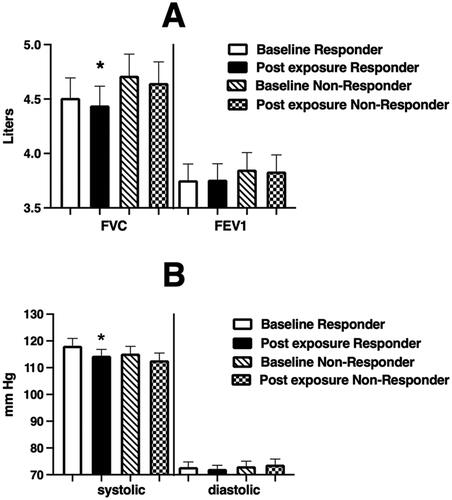
Figure 5. Sputum Inflammatory Response to WSP of responsive volunteers as defined by %PMNs at 24 hours.
Sputum % PMN (Panel A), PMN/mg sputum (Panel B), IL-1β (Panel C), IL-6 (Panel D), IL-8 (Panel E) and TNFα (Panel F) at baseline, 6- and 24-hours post WSP challenge in the cohort of volunteers responsive to WSP based on a change from baseline of the 24-hours %PMN of at least 10% (N = 28). Asterisk denotes mixed model analysis using a compound symmetry covariance matrix where fit used Restricted Maximum Likelihood (REML) to allow for overall and multiple comparisons and missing data.
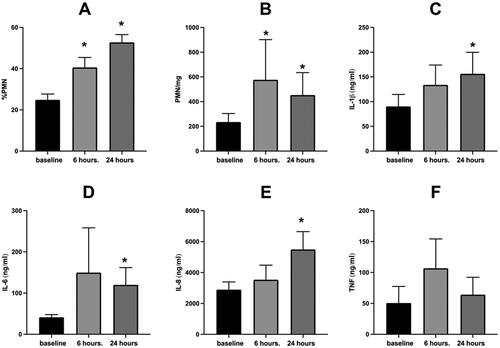
Figure 6. Spirometric (Panel A) and blood pressure (Panel B) endpoints at baseline and immediately after WSP challenge of responsive volunteers as defined by %PMNs at 24 hours.
Spirometric and blood pressure endpoints at baseline and immediately after WSP challenge in responders and non-responders defined at 24 hours. Asterisk denotes paired t-test.
Data availability statement and materials
The datasets used and/or analyzed during the current study are available from the corresponding author on reasonable request. Additionally, this study is listed in ClinicalTrials.gov (NCT02767973), and data will be posted in that database upon completion of the study. Where informed consent was given, all unused de-identified biospecimens will be stored and curated in the CEMALB Biorepository (IRB# 05-2528) for potential future use.