
Figures & data
Figure 1. Concept for experimental design, starting from non-target in vitro inhalation exposure based on worst-case conditions and aiming at quantitative in vitro to in vivo extrapolation (QIVIVE).
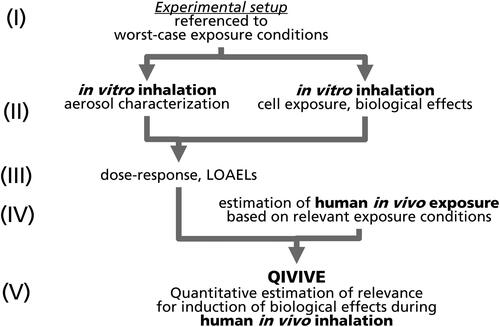
Table 1. Exposure scenarios using nebulized TM1 and TM2, filtered aerosol and the pure main component from TM1.
Figure 2. Concept (a) and realization of aerosol generation and cell exposure (b,c). (1) Nebulizer and cartridge, (2) dilution system, (3) temperature and humidity control inside AE-Box, (4) ventilator, (5) final dilution flow, (6) box waste flow, (7) custom light scattering photometer, (8) P.R.I.T® ExpoCube®, (9) exposure control (flows, temperature), (10) filter and FT-IR sampling (11) sheath air flow, (12) primary aerosol delivery, (13) pre-dilution, (14) division of aerosol flow, (15) generation waste flow, (16) delivered flow into AE-Box.
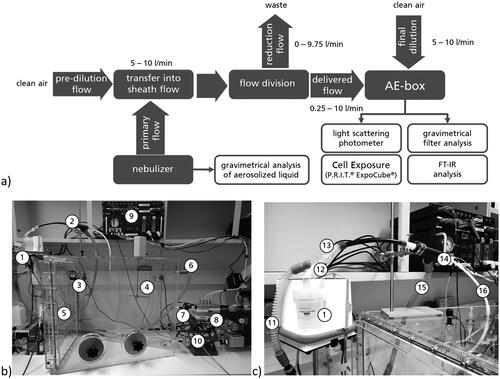
Figure 3. Results from aerosol characterization during application of basic scenarios using TM1 at different concentration levels. (a) Total mass and actual aerosol concentration inside the AE-box. (b) Relative results from gas-phase analysis by FT-IR and aerosol concentration measurement by light scattering carried out in front of the exposure device.
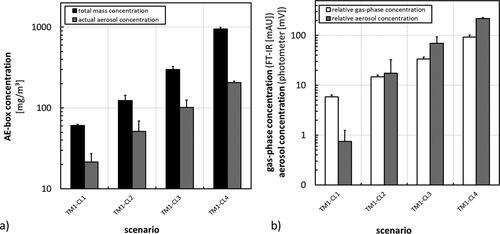
Figure 4. Results from aerosol characterization during application of additional scenarios. (a) Total mass and actual aerosol concentration inside the AE-box. (b) Relative gas-phase and aerosol concentrations during sampling for cell exposure after filtering of aerosols from TM1 (TM1(filtr)), with the pure main component from TM1 (TM1(mc)) or during nebulization of TM2 at different concentration levels (CL2 or CL4).
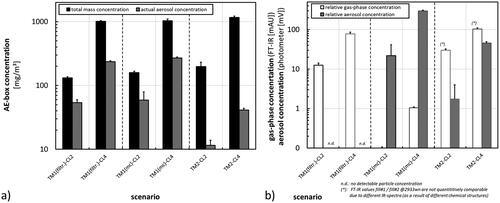
Figure 5. Effects on the cellular mitochondrial membrane potential (MMP) after exposure to nebulized TM1 at different concentration levels. (a) Measurement immediately after exposure (0 h); (b) measurement following to a 24-h post-exposure incubation phase. Results are presented as percentage of control in comparison to clean air controls. Dots represent results from single exposure experiments. Statistical best-fit analysis with 95% upper and lower confidence intervals (UCL, LCL).
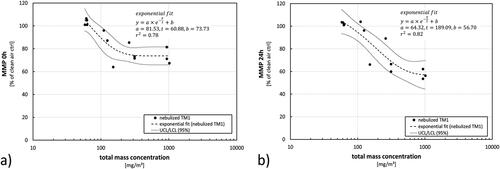
Figure 6. Results from analysis of the mitochondrial membrane potential (MMP) immediately after exposure (0 h) (a) or 24 h later (b). Fit (dashed line) with confidence interval at a level of 95% (dotted lines) represent the results from exposures toward nebulized TM1 (). Results from single experiments using additional scenarios are shown in comparison (open circles = nebulized TM1 (filtered), black diamonds = nebulized main component from TM1, crosses = nebulized TM2). Total mass concentrations during filtered scenarios refer to the related AE-box concentrations during these exposure scenarios before filtering. Results not lying within the confidence interval from the TM1 fit are considered as significantly different.
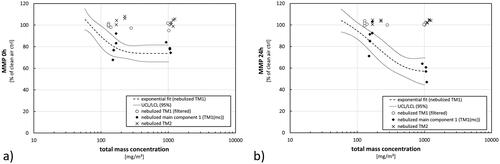
Figure 7. Effects on cellular stress after exposure to nebulized TM1 at different concentration levels. (a) Measurement immediately after exposure (0 h); (b) measurement following to a 24-h post-exposure incubation phase. Results are presented as percentage of control in comparison to clean air controls. Dots represent results from single exposure experiments. Statistical best-fit analysis with 95% upper and lower confidence intervals (UCL, LCL).
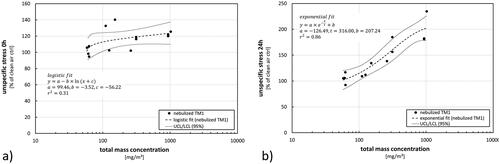
Figure 8. Results from analysis of cellular stress immediately after exposure (0 h) (a) or 24 h later (b). Fit (dashed line) with confidence interval at a level of 95% (dotted lines) represent the results from exposures toward nebulized TM1 (). Results from single experiments using additional scenarios are shown in comparison (open circles = nebulized TM1 (filtered), black diamonds = nebulized main component from TM1, crosses = nebulized TM2). Total mass concentrations during filtered scenarios refer to the related AE-box concentrations during these exposure scenarios before filtering. Results not lying within the confidence interval from the TM1 fit are considered as significantly different.
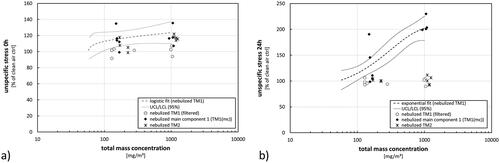
Figure 9. Effects on IL-8 release after exposure to nebulized TM1 at different concentration levels. Measurements following to a 24-h post-exposure incubation phase. Results are presented as percentage of control in comparison to clean air controls. Dots represent results from single exposure experiments. Statistical best-fit analysis with 95% upper and lower confidence intervals (UCL, LCL).
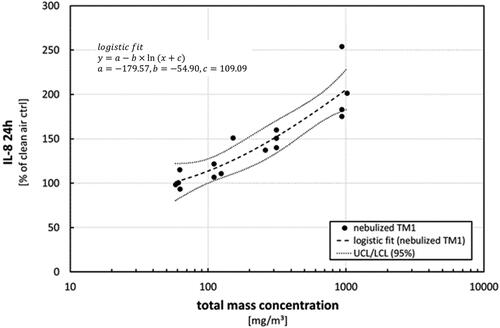
Figure 10. Results from analysis of Il-8 release within 24 h after exposure. Fit (dashed line) with confidence interval at a level of 95% (dotted lines) represent the results from exposures toward nebulized TM1 (). Results from single experiments using additional scenarios are shown in comparison (open circles = nebulized TM1 (filtered), black diamonds = nebulized main component from TM1, crosses = nebulized TM2). Total mass concentrations during filtered scenarios refer to the related AE-box concentrations during these exposure scenarios before filtering. Results not lying within the confidence interval from the TM1 fit are considered as significantly different.
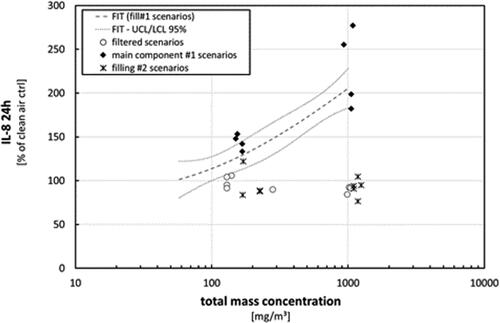
Table 2. Assignment of components of the nebulized materials to the respective aerosol phases at the different exposure scenarios as a result of the aerosol characterization.
Figure 11. Results as presented in for stress and for interleukin-8 release transferred to the actual aerosol concentration as dose-metric.
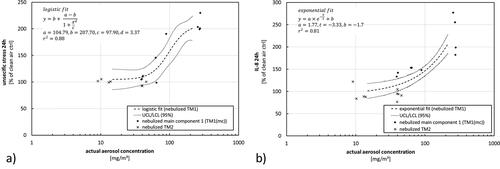
Table 3. Estimation of more realistic room concentrations during nebulization using the given nebulizer at maximum output according to the manufacturers’ manual in a 54 m² room for different use cases including variations of room air exchange rate and nebulizer to receptor distance.
Table 4. QIVIVE based on in vivo human exposure estimation and experimental in vitro inhalation LOAEL values.
Data availability statement
The data that support the findings of this study are available from the corresponding author, Detlef Ritter, upon reasonable request.