
Figures & data
Table 1. The different lung exposed groups and the number of which were exposed to fine and coarse particles.
Figure 1. The experimental set-up for redispersion of the sampled rock and brake particles and delivery to the exposed rat lung via an exposure chamber.
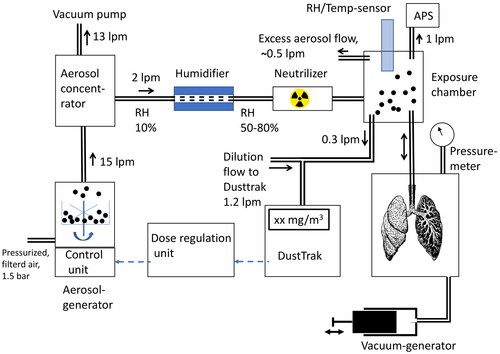
Figure 2. Typical diagram of the air velocity measurement using a pneumotachograph connected to a rat lung. After 15 min of stabilization, the lung was exposed to particles, typically for 25 min. This was followed by 50 min of post-exposure during which a deep breath was initiated every 5 min. During coarse particle exposure, the pneumotachograph was connected to the rat lung 4 times for short 30 s measurements. The vertical gray lines show each of the 5-min occasions when the tidal volume was measured during 12 deep breaths (10 s).
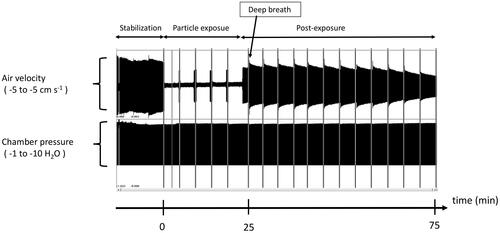
Figure 3. (A) Normalized particle mass distributions for fine and coarse particle modes in the exposure chamber during quartzite exposure and corresponding mass distribution when collecting quartzite pavement PM10 at the road simulator. (B) Normalized particle mass distributions for fine and coarse particle modes in the exposure chamber during LD brake exposure and corresponding mass distribution when collecting LD-brake PM10 particles at the pin-on-disk machine.
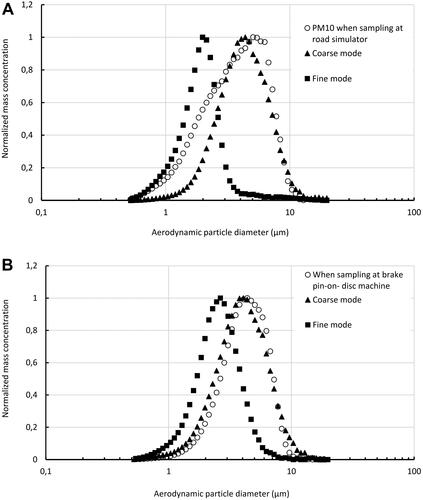
Figure 4. The ratio of coarse to fine quartzite and LD brake particles during exposure.
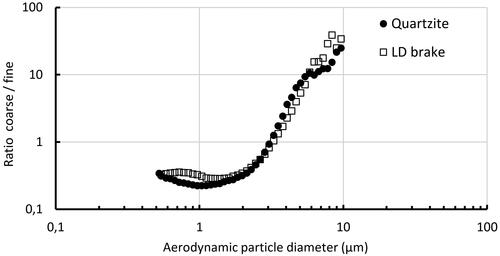
Table 2. Mass median diameter, geometric standard deviation (GSD) and total particles dose, fine and coarse, respectively, for the different exposed groups.
Figure 5. The most abundant elements in the fine fractions of the three rock materials and two types of brake particles (light duty and heavy duty). Others include e.g. P, Sn and Sb.
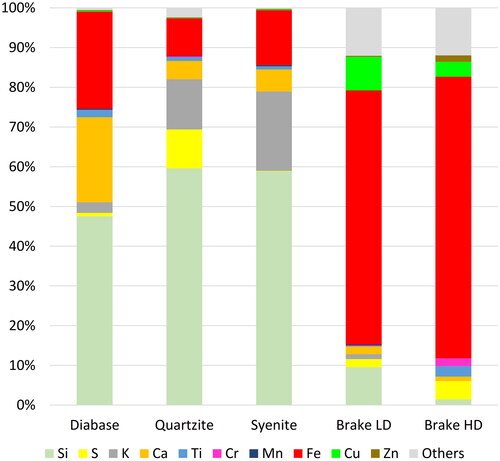
Figure 6. Normalized tidal volume (TV) for coarse particle exposure over time of three rock and two brake materials, and a control group. The TV of certain time points was normalized to the TV at time 0 (TVt/TV0). error bars present the ± standard error of the mean. The ventilated rat lungs were exposed to the particles after 15 min of stabilization. The particle exposure started at time zero and continued for 25 min.
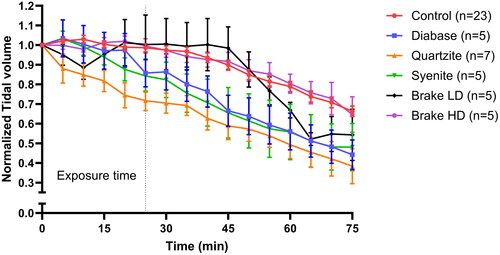
Figure 7. Normalized tidal volume (TV) for different rocks and brake particles for fine and coarse particles. The TV of a given time point was normalized to the TV at time zero (TVt/TV0). error bars present the ± standard error of the mean. The ventilated rat lungs were exposed to the particles after 15 min. of stabilization. The particle exposure started at time zero. For all coarse particles, the exposure time was 25 min. For fine particles, the exposure time varied between 20 and 35 min. due to technical issues. For the fine particles of diabase and syenite, the number of TV measurements until 35 min. were reduced compared to the number given in the legends, but never less than 3.
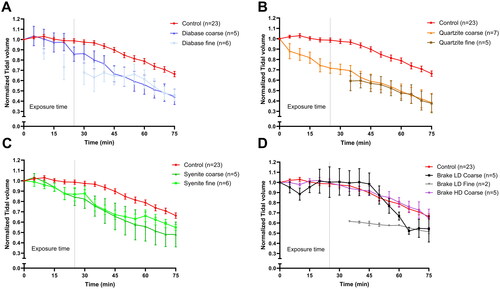
Figure 8. Cytokine levels in rat lung perfusate. A: TNF levels, B: CINC1/CXCL1 levels, and C: MIP1α/CCL3 l levels in perfusate sampled at t = 0, 25 and 75 min. Values are median. */**/*** = p < 0.05/0.01/0.001 Brake particles LD vs. control, ¤ = p < 0.05 Brake particles HD, # = p < 0.05 diabase vs. control.
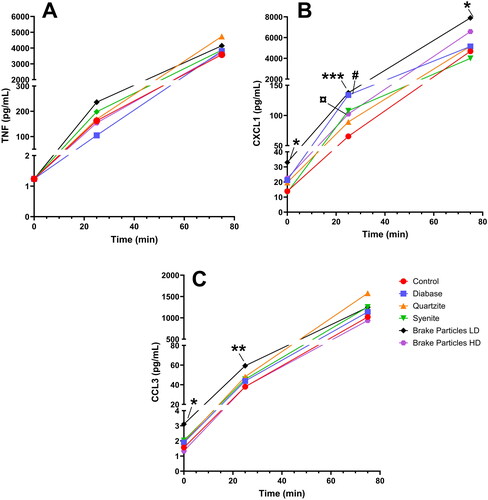
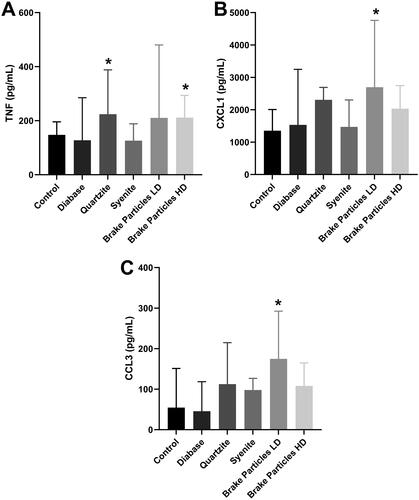
Figure 9. Cytokine measurements in bronchoalveolar lavage fluid (BALF). A: TNF level, B: CXCL1 level, and C: CCL3 level in BALF samples at the end of the experiment. Values are median with 95% confidence interval. *=p < 0.05.
Supplemental Material
Download Zip (1.5 MB)Data availability statement
The data that support the findings of this study are available from the corresponding author, Mats Gustafsson, upon reasonable request.