
Figures & data
Figure 1. Coronal and sagittal views with the generated 3D nasal cavity model.
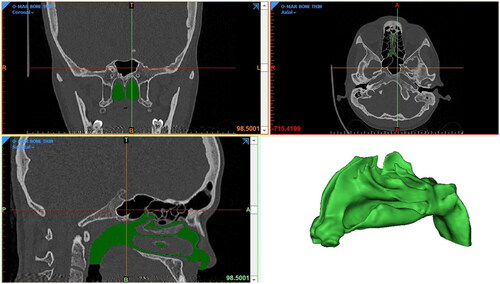
Figure 2. Meshing details at the mid-nasal cross-section.
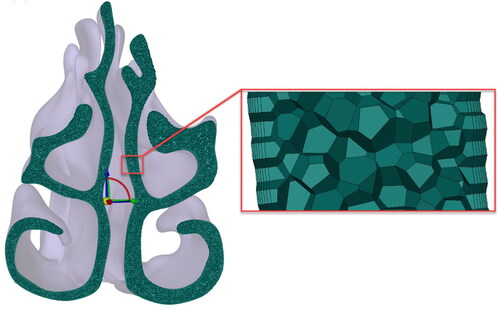
Figure 3. Evaluating mesh independence for (a) neonate, (b) infant, and (c) adult nasal cavities.
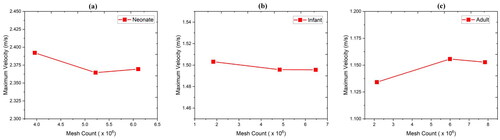
Figure 4. Regional divisions in the nasal cavity for (a) neonate, (b) infant, and (c) adult.
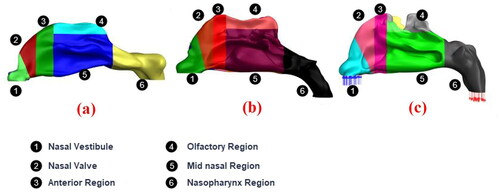
Figure 5. Cross-sectional area comparison with the literature (Xi et al. Citation2012).
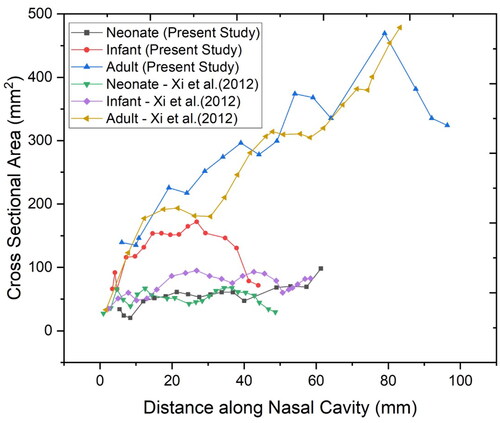
Figure 6. Validation of deposition efficiency (DE %) vs. impaction parameter (IP) for microparticles from 2 to 60 µm in an adult nasal cavity.
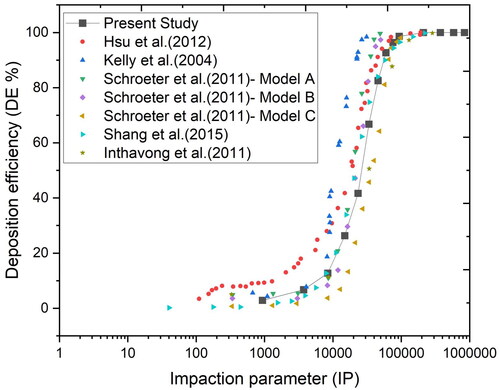
Figure 7. Validation of deposition efficiency (DE %) vs. impaction parameter (IP) for microparticles from 2 to 60 µm in (a) neonate and (b) infant nasal cavity.
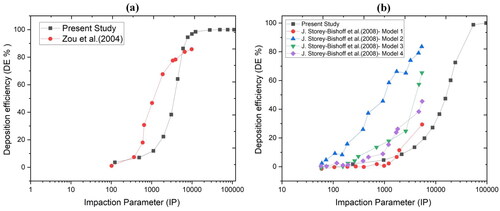
Figure 8. Velocity profiles along the nasal cavity (a) neonate, (b) infant, and (c) adult.
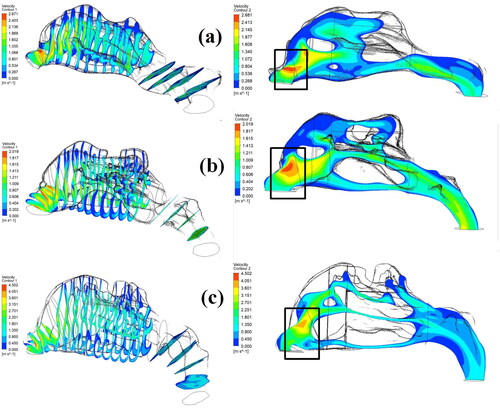
Figure 9. Velocity plots along the nasal cavity (a) maximum velocity and (b) normalized maximum velocity.
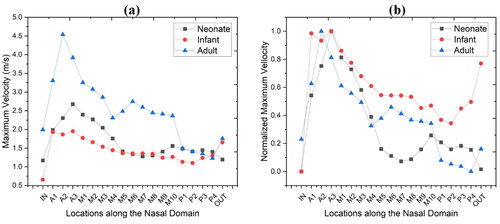
Figure 10. Maximum wall shear stress variations.
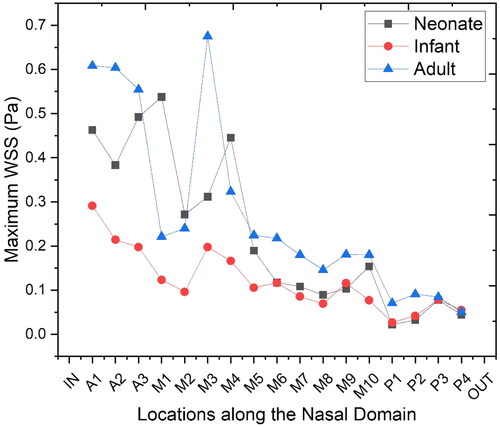
Figure 11. Total deposition efficiency (TDE %) for three age groups.
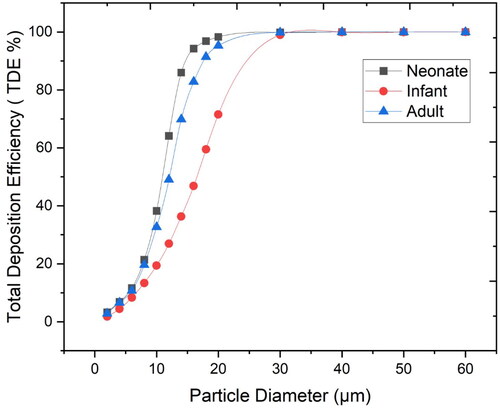
Figure 12. Regional particle deposition (a) vestibule, (b) nasal valve, (c) mid nasal region, (d) olfactory, (e) anterior, and (f) nasopharynx region.
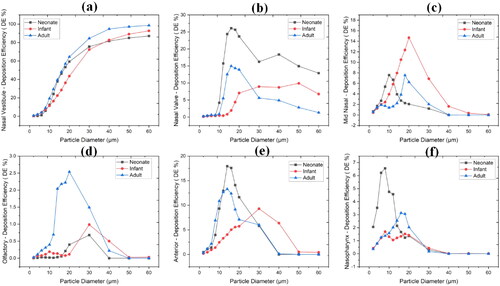
Figure 13. Particle deposition for 2, 10, 14, and 20 µm.
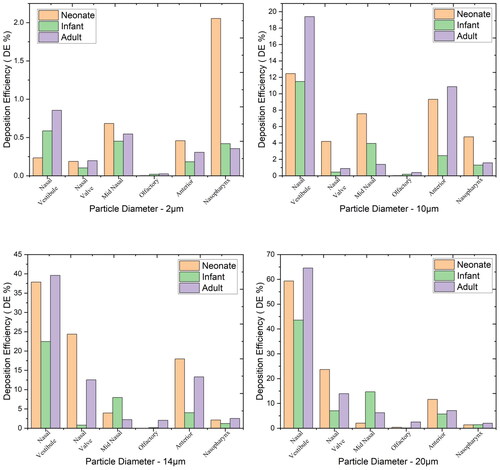
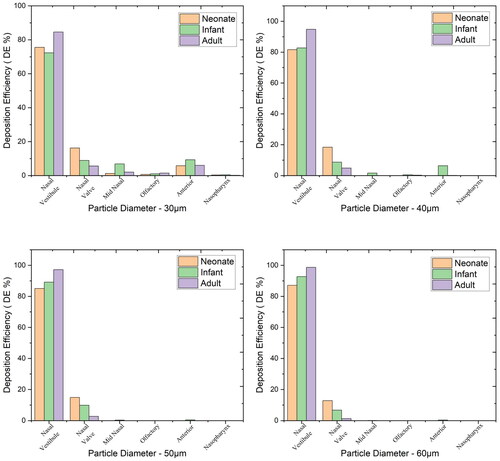
Figure 14. Particle deposition for 30, 40, 50, and 60 µm.
Data availability statement
All the data relevant to this study is given in this article.