
Figures & data
Table 1. Descriptive characteristics of study participants (n = 50).
Figure 1. Study participant flow chart.
Note: Dotted box was study data collection point.
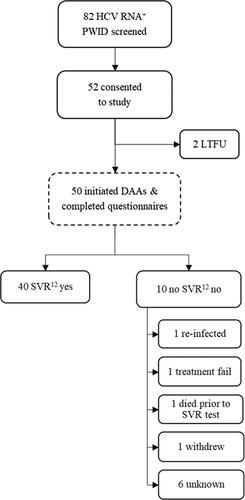
Table 2. Average questionnaire scores at treatment initiation (n = 50).
Table 3. Spearman’s correlation analysis for continuous variables (n = 50).
Table 4. Multiple linear regression coefficients for original and bootstrap samples.
Supplemental material
Supplemental Material
Download MS Word (17.9 KB)Data availability
The anonymized data will be held by the research team. Sharing of data will be considered for researchers who provide a methodologically sound proposal.