
Figures & data
Table 1. Summary statistics of monthly housing returns.
Figure 1. Conditional variance generated by GARCH-M models.
Note. This figure plots the conditional variance generated by GARCH-M models over the period February 1954 to October 2019.
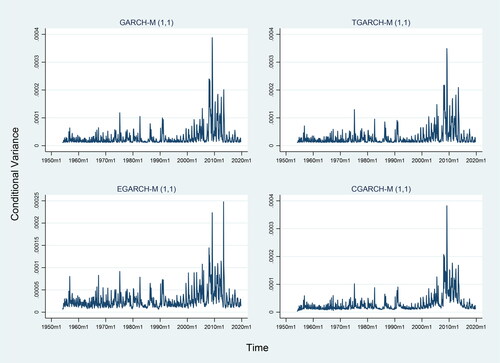
Table 2. GARCH-M results at the national level.
Table 3. Summary statistics of quarterly housing returns.
Table 4. Intertemporal risk-return relationship across MSAs.
Table 5. Risk-return analysis based on the FHFA purchase-only index.
Table 6. Summary statistics of monthly housing returns.
Table 7. Intertemporal risk-return relationship across MSAs.
Table 8. Intertemporal risk-return relationship of housing in census divisions.
Table 9. Intertemporal risk-return investigation in housing segmentations.