
Figures & data
Figure 1. Map of the area under study (Dawuro zone) in southern Ethiopia Source: Author's sketch by using GPS data (2018).
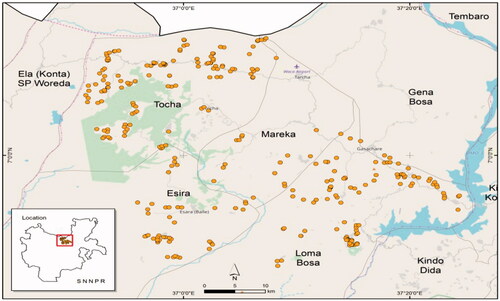
Table 1. Descriptive statistics of socio-demographic characteristics of the households.
Table 2. Proportion of maize moved through different channels by the gender of household decision-makers.
Table 3. Producers’ share in market price, total marketing costs, and gross margins by the gender of decision-makers in different channels (ETB/100 kg).
Table 4. Monthly price deviation (between maximum and minimum) in different marketing channels (ETB/100 kg).
Table 5. Seasonal price variability for the four marketing channels by the gender of household decision-makers (ETB/100 kg).
Table 6. Overall efficiency of different marketing channels.
Table A1. Questionnaires used to cluster households into male, female and joint decision-making groups. Household decision-making and labor division for maize production, consumption and marketing in 2018.