
Figures & data
Table 1. Information given to participants in each of the experimental conditions.
Figure 1. The four pictures shown to participants based on Adams et al. (Citation2016).

Table 2. Social and demographic characteristics of the representative Norwegian sample population (n = 1206).
Figure 2. Open-Ended Emotive Projection Test results; dimension 1 (30.0%), dimension 2 (21.4%).
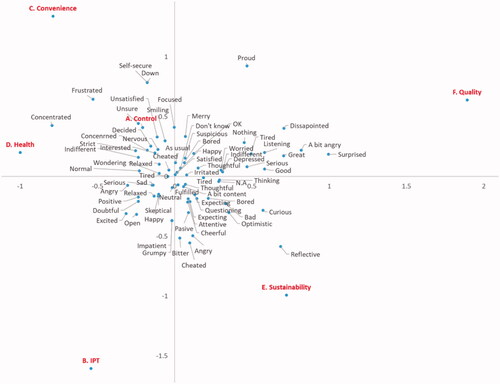
Table 3. Mean Emotive Projection Test responses per experimental condition.
Figure 3. Consumers’ impressions of information regarding food processed using IPT; dimension 1 (51.8%), dimension 2 (22.1%).
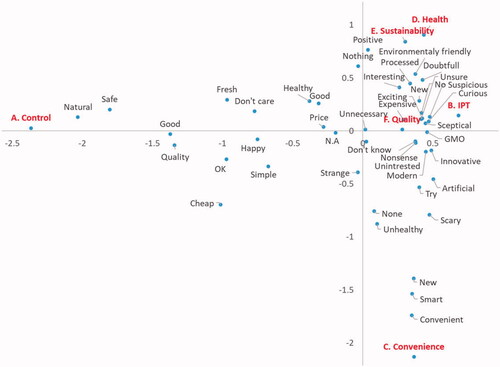
Table 4. Appropriateness of IPT, IPT with benefits and control for different product categories.
Table 5. Differences in consumer willingness to try, eat and pay between experimental condition groups.
Table 6. Differences in consumer attitudes between experimental condition groups.
Table 7. Differences in consumer-reported appropriateness of communication between experimental condition groups.