
Figures & data
Table 1. Second section of the questionnaire about the beliefs and perceptions of male and female GNR militaries regarding domestic violence.
Table 2. Third section of the questionnaire about the GNR militaries’ decision to intervene or not when confronted with different situations, and in case of intervention, with what degree of responsibility.
Figure 1. Data distribution boxplot for questions 3 (“violence against women only happens when there are other problems in the family …”), 6 (“men only hit women when they have “lost their mind” or when women have done something”), 7 (“if women behaved like good wives they would not be abused”), 9 (“an unfaithful woman deserves to be punished”), and 13 (“intimate partner violence is a private matter…”) of by sex. Kolmogorov–Smirnov Test *p = 0.011, **p < 0.001 (1—disagree completely to 5—agree completely).
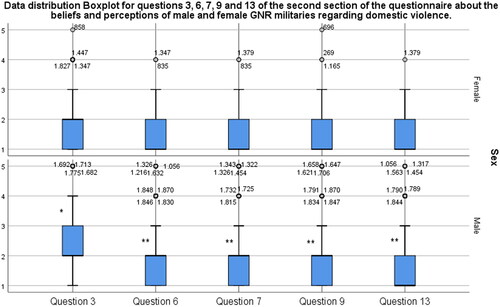
Figure 2. Data distribution boxplot for the degree of responsibility in situations 2 (“during an argument a man hits his female partner and apologizes afterwards”), 3 (a woman is repeatedly battered by her partner, which causes small cuts and bruises, but she does not want to report him”), 5 (“during an argument a man slaps his partner and she hits him back”), and 6 (“a woman is constantly belittled and humiliated by her partner”) of by sex. Mann–Whitney U test with statistical significance p < 0.05 (0-does not intervene, 1–5 ordinal scale for the degree of responsibility).
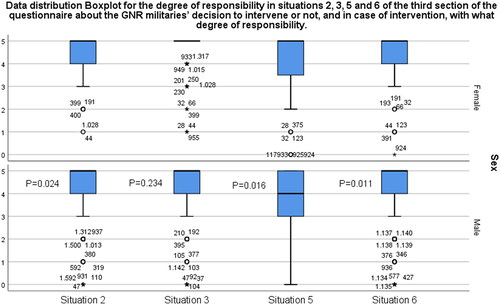
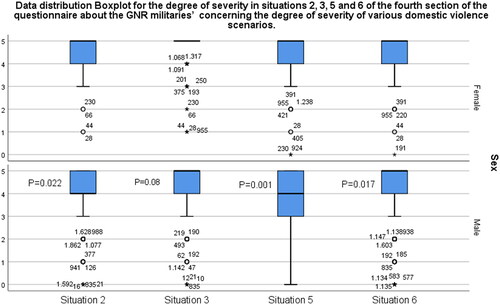
Figure 3. Data distribution boxplot for the degree of severity in situations 2 (“during an argument a man hits his female partner and apologizes afterwards”), 3 (“a woman is repeatedly battered by her partner, which causes small cuts and bruises, but she does not want to report him”), 5 (“during an argument a man slaps his partner and she hits him back”), and 6 (“a woman is constantly belittled and humiliated by her partner”) of by sex. Mann–Whitney U Test with statistical significance p < 0.05 (0–5 ordinal scale for the degree of severity).
DATA AVAILABILITY STATEMENT
All analyzed data is presented in the paper.