Figures & data
Figure 1. Schematic representation of the conjugation reaction between PEG-functionalized liposomes and the protein CLU via a carboxy-to-amine reaction in the presence of the crosslinker and stabilizer EDC and NHS.
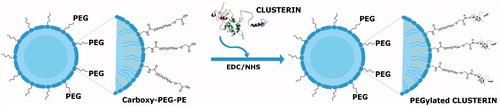
Figure 2. Determination of particle size distribution (A) and zeta potential (B) of nanoliposomes before and after CLU conjugation. Statistically significant differences were found between the non-PEGylated (PC:Chol) and PEGylated formulations. *p < 0.05 versus PC:Chol, ***p < 0.001 versus PC:Chol, respectively.
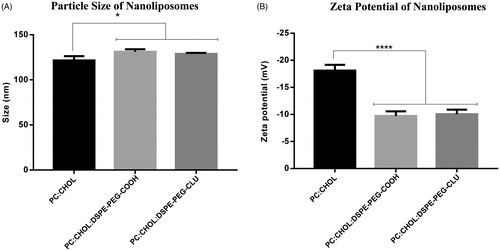
Table 1. Liposomal formulations and their characterization.
Figure 3. AFM imaging of nanoliposomes. (A) 2D images of CLU protein, (B) PEG-functionalized liposomes, (C) purified CLU-PEGylated nanoliposomes and (D) their height analysis. ***p < 0.001 versus CLU, +++p < 0.001 versus CLU-PEGylated nanoliposome.
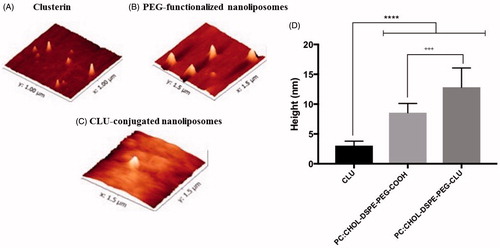
Figure 4. Stability assay of PEG-functionalized nanoliposomes. The integrity of PEG-functionalized liposomes at room temperature and 37 °C was monitored by DLS after 1, 24, 48 and 168 h.
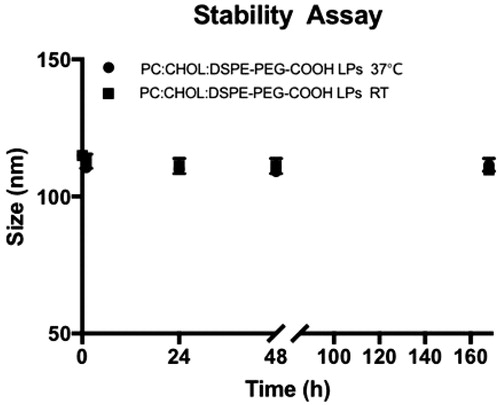
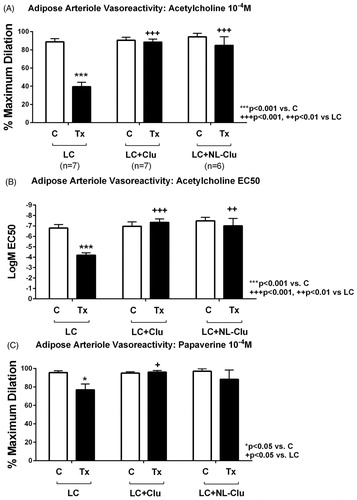
Figure 5. Human arteriole dilation response. A and B show response to acetylcholine with A showing maximum dilation response (10−4 M dose) and B showing EC50 values. Light chain treatment reduced dilator response to acetylcholine compared to baseline control. Co-treatment of LC with free CLU and PEGylated-nanoliposomal CLU (NL-CLU) restored dilator response to acetylcholine. Note that the y-axis of B is in inverse order. C shows response to papaverine. There was a modest reduction in dilator response in LC treated arterioles; LC co-treatment with free CLU or NL-CLU showed no significant difference with baseline control response. There was no significant difference in dilator response to acetylcholine or papaverine in arterioles treated with LC and NL-CLU versus LC and free CLU.