
Figures & data
Figure 1. OC-curves of several sampling plans where Pa denotes the acceptance probability: (a) attributes sampling plans and (b) variables sampling plans. The idealized OC-curves corresponding with complete inspection are shown in gray.
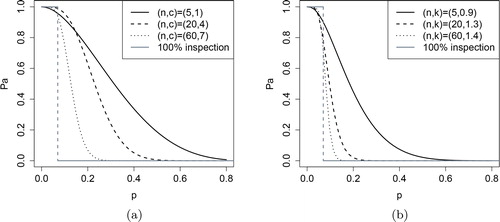
Figure 2. Algorithms for the design of two-point DSP plans. The parameters of the procedures determine the producer’s and consumer’s risk point. A constraint on the sample sizes can be chosen by specifying
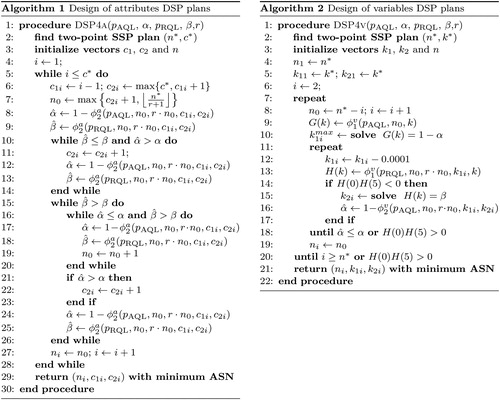
Figure 3. The ASN at as a function of the sample size n1 = n2 for several two-point DSP-
plans that pass through two points
and
The dotted identity line correspond to an SSP-(n1, k1) where ASN
The gray and black dots correspond to the plans obtained by Sommers (Citation1981) and Algorithm 2, respectively.
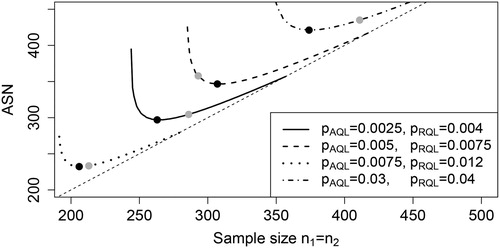
Figure 4. The interface of our web tool that consists of a left panel to set the sampling plan parameters and a right panel to visualize the plan with an OC-curve and an ASN curve. The selection of the main sheet determines the type of inspection: attributes inspection or variables inspection. The left panel allows to implement single-stage and double-stage sampling plans.
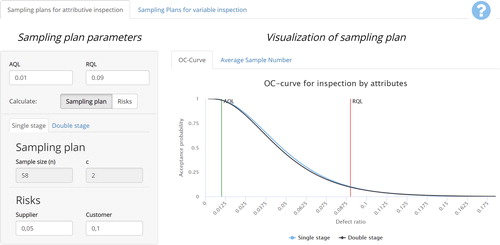
Figure 5. Left panels of the interface: (a) the parameters of a DSP- plan for inspection by attributes, (b) the parameters of an SSP-(n, k) plan for inspection by variables, and (c) the parameters of a DSP-
for inspection by variables. The panel in (a) is part of the main sheet entitled sampling plans for attributes inspection as shown in . The panels in (b) and (c) are part of the main sheet entitled sampling plans for variables inspection.
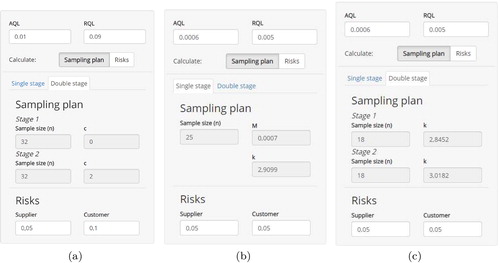
Figure 6. (a) The ASN curve of a DSP- for variables inspection. (b) The risks associated to an individual ISO 3951-1 SSP-
plan for inspection by variables.
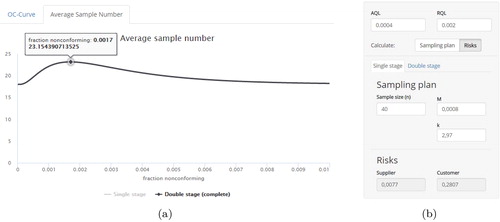
Figure A1. Examples of curves and
as defined in Equation[11]
[11]
[11] for an SSP-
plan and
and
as defined in Equation[A.1]
[A.1]
[A.1] for a DSP-
plan with fixed choices of c1 and n2: (a)
and
with
and
(b)
and
with
and
Risks are set to
The gray and black dotted lines correspond to the curves
and
respectively to which
and
converge for large c2.
![Figure A1. Examples of curves nl(c2) and nu(c2) as defined in Equation[11][11] nl(c)=inf{n|ϕassp(pRQL,n,c)≤β} and nu(c)=sup{n|ϕassp(pAQL,n,c)≥1−α},[11] for an SSP-(n,c2) plan and n1l(n2,c1,c2) and nu(n2,c1,c2) as defined in Equation[A.1][A.1] n1l(n2,c1,c2)=inf{n1|ϕadsp(pRQL,n1,n2,c1,c2)≤β} and n1u(n2,c1,c2)=sup{n1|ϕadsp(pAQL,n1,n2,c1,c2)≥1−α}.[A.1] for a DSP-(n1,n2,c1,c2) plan with fixed choices of c1 and n2: (a) c1=0 and n2=50, with pAQL=1% and pRQL=10%, (b) c1=10 and n2=350, with pAQL=2% and pRQL=4%. Risks are set to α=β=5%. The gray and black dotted lines correspond to the curves nl(c2)−n2 and nu(c2)−n2 respectively to which n1l(n2,c1,c2) and nu(n2,c1,c2) converge for large c2.](/cms/asset/9684c95a-4cd2-4513-8d4e-13714454836e/lqen_a_1641207_a0001_b.jpg)
Table B1. Table of two-point SSP and DSP plans indexed by and