Figures & data
Figure 1. Taxonomy of outliers. Magnitude (blue) and shape (red) outliers follow the decreasing dynamics from Day 1 to Day 3 of the bulk of data (grey curves). In contrast, the evolution outlier (green), which does not exhibit magnitude or shape differences, evolves differently than the grouped curves that share a decreasing day-to-day trend.
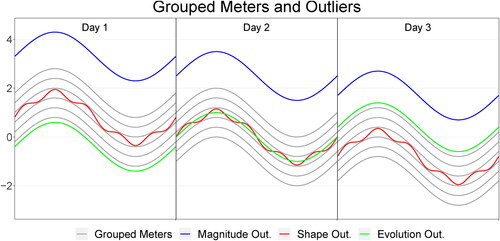
Figure 2. Context—Data from multiple smart meters.
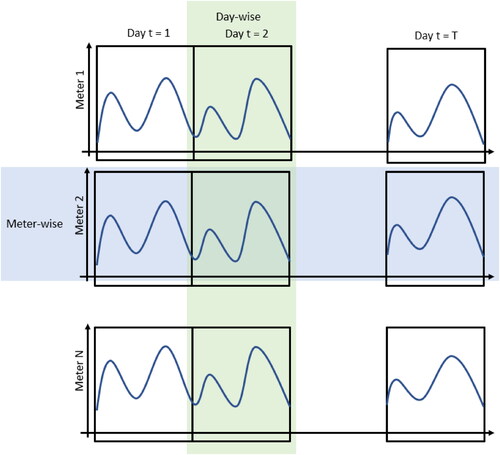
Figure 3. Synthetic voltage example for one meter for 5 days.
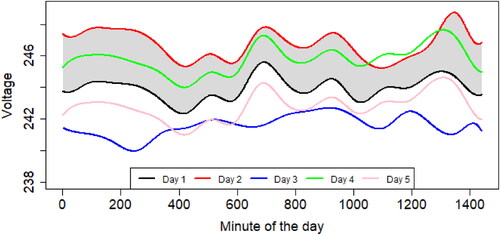
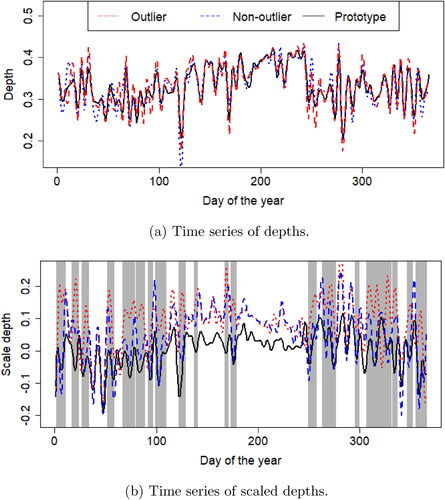
Figure 4. Time series of FD and time series of scaled FD for two Functional Time Series.
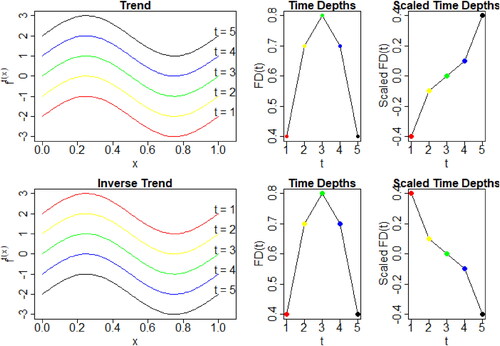
Table 1. Simulation results for Model 1.
Table 2. Simulation results for Model 2.
Table 3. Identifiers of the detected Magnitude (M), Shape (S), Evolution based on depth (E) and Evolution based on scaled depth () outliers.
Figure 5. Voltage circuit: evolution outlier not detected with other method. (a) Non-outlier vol2818. (b) Outlier vol9019. (c) Time series of depths.
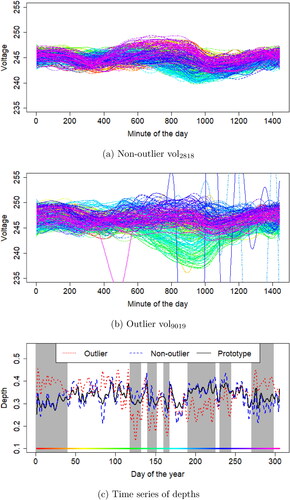
Figure 6. Photo-voltaic energy generation: Computed depths on the derivatives allow detecting outliers not unmasked by the analysis without derivatives. (a) Time series of depths computed on the zero derivative. (b) Time series of depths computed on the first derivative.
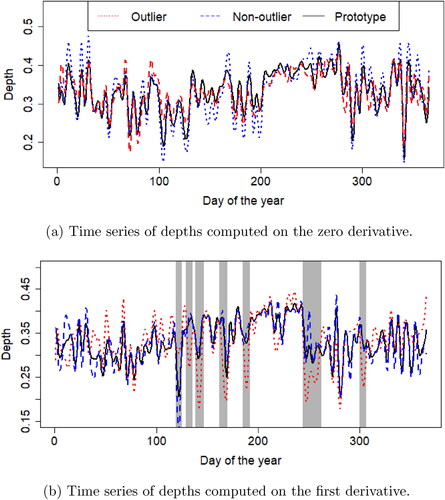
Figure 7. Photo-voltaic energy generation: Scaled depths detect outliers not detected by classical depths. (a) Time series of depths. (b) Time series of scaled depths.