
Figures & data
Table 1. Acronym definitions.
Figure 1. Google Trends, interest of Six Sigma from 2004 to 2022. Interest over time. The numbers represent the search interest relative to the highest point on the chart for the given region and time.
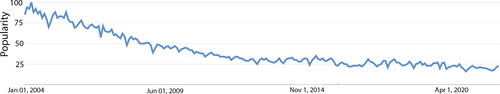
Figure 2. Areas of knowledge of Q4.0.
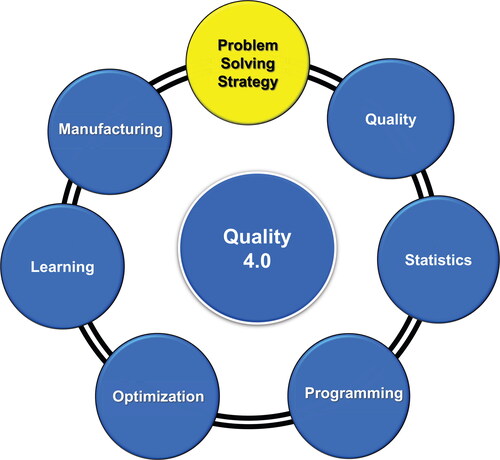
Table 2. Confusion matrix.
Figure 3. PMQ scheme.
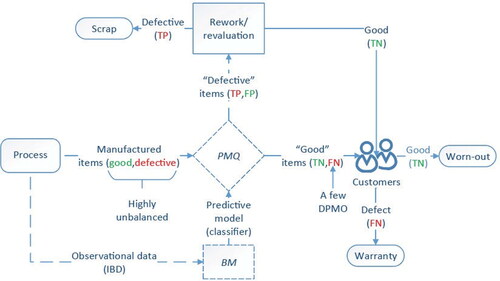
Figure 4. PMQ problem solving strategy (Escobar, Macias et al. Citation2022).
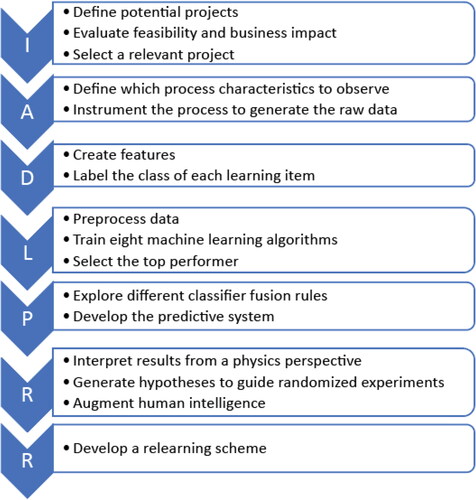
Table 3. Quality 4.0 certifications curricula.
Figure 5. Hierarchy by Q4.0 belts.
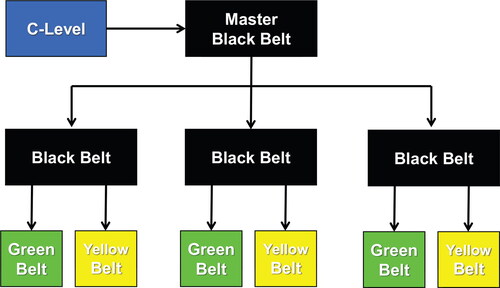
Table 4. Six Sigma versus Quality 4.0.
Figure 6. Kaggle winners.
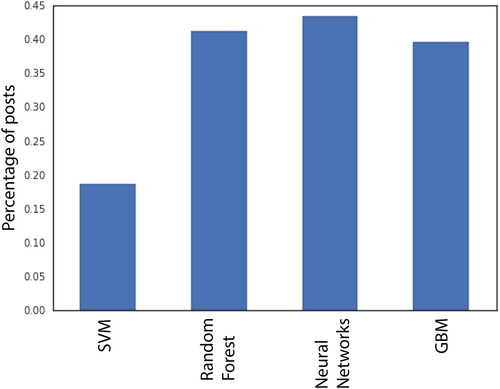
Figure 7. Kaggle winners.
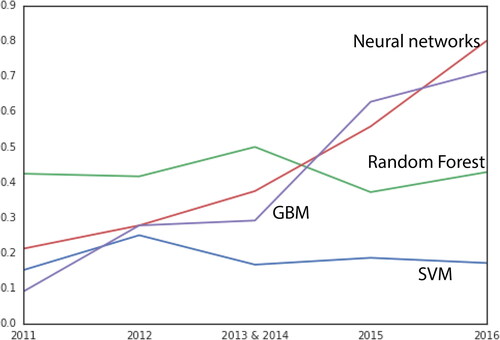
Figure 8. Data driven and ML methods supporting engineering knowledge discovery.
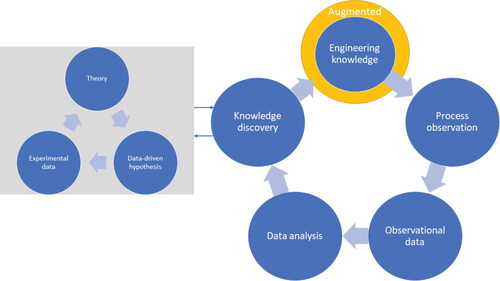
Figure 9. Year-over-year percentage of change in publications by quality philosophy.
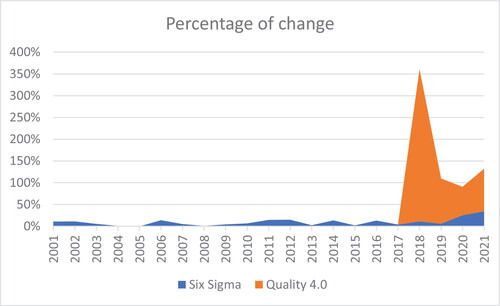
Figure 10. 3D quality pattern. Green triangles denote good quality, and red circles denote a defective item.
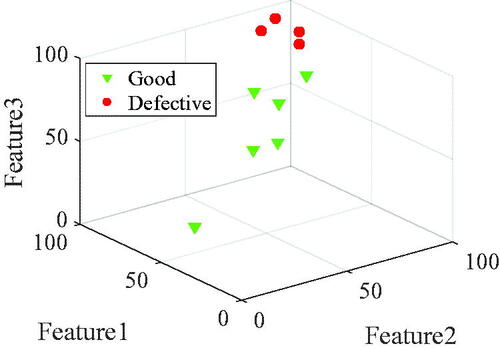
Table 5. Virtual feature values and the associated quality status of each sample.
Figure 11. Decision tree for choosing a control chart (Minitab).
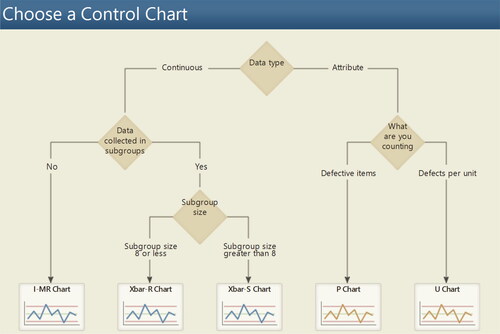
Figure 12. Control charts: I-MR univariate control chart – Feature 1.
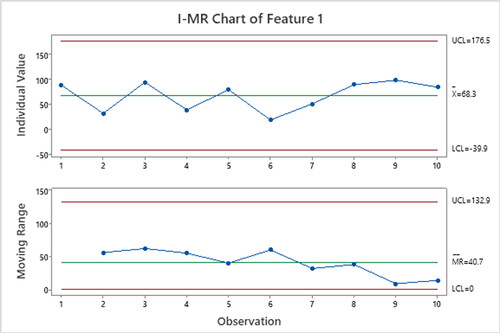
Figure 13. Control charts: I-MR univariate control chart – Feature 2.
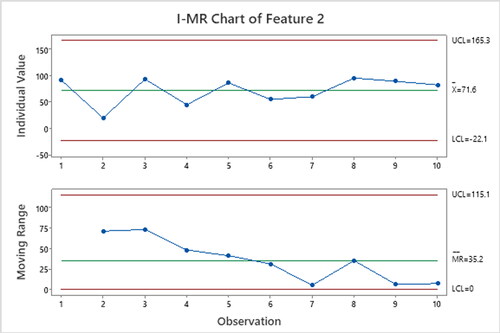
Figure 14. Control charts: I-MR univariate control chart – Feature 3.
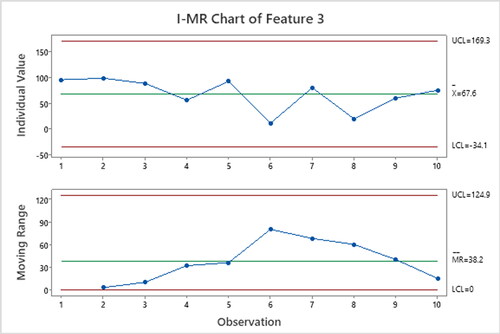
Figure 15. Control charts: Multivariate Hotelling’s T2 – Features 1–3.
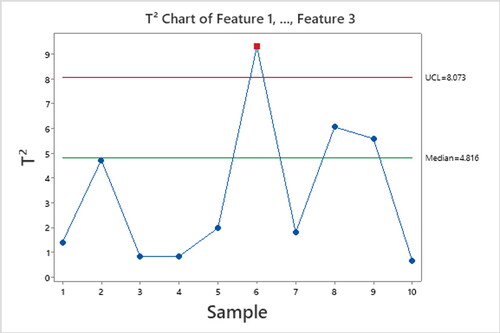
Figure 16. Control charts: Multivariate generalized variance control charts – Feature 1–3.
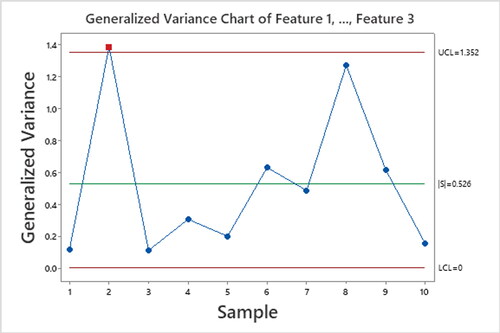
Figure 17. Linear separation scheme based on the support vector machine.
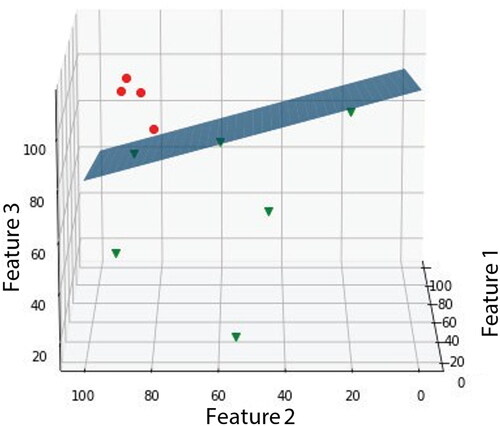
Table 6. Confusion matrix for this case study using SVM.