
Figures & data
Figure 1. Brief sketch of the fMRI experimental design and two frames from two of the five video clips which were used as visual roughness stimuli. Video clips show a right index fingertip moving from side to side for 3 seconds.
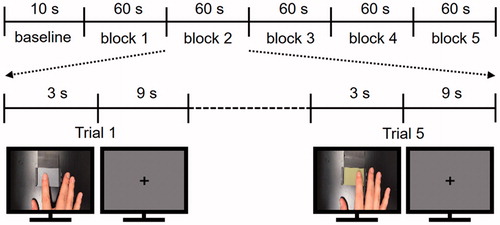
Figure 2. Results of the whole brain searchlight MVPA. The analysis identified four brain regions showing significant performance in discriminating visually evoked roughness intensities. The bottom panels show the decoding accuracies for each of the 15 participants and the rightmost bar indicates the average accuracy across the participants. Chance level is marked by the dashed line (20%).
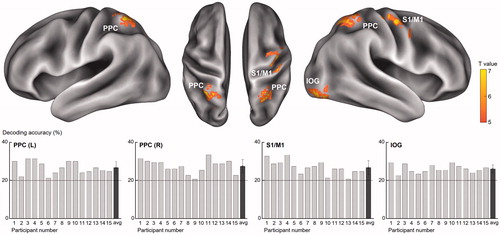
Figure 3. Confusion matrices for predictions of the classifier for each identified cluster. The rows of the matrix indicate the actual visual roughness intensity provided to the participants and the columns indicate the intensity predictions by a neural decoder. The cells on the diagonal entries (correct predictions) are highlighted in red and the cells where the misclassification rates exceeded chance level (20%) are highlighted in orange.
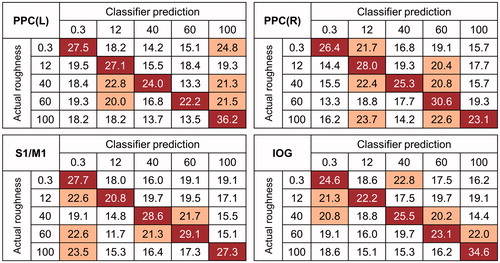
Table 1. Identified clusters showing significantly higher decoding accuracies than chance level (p<.001 uncorrected, size >50).
Figure 4. Correlations between behavioural and neural decoding accuracies for visual roughness intensities. The neural decoding accuracies for the 15 participants are plotted over their behavioural JND values.
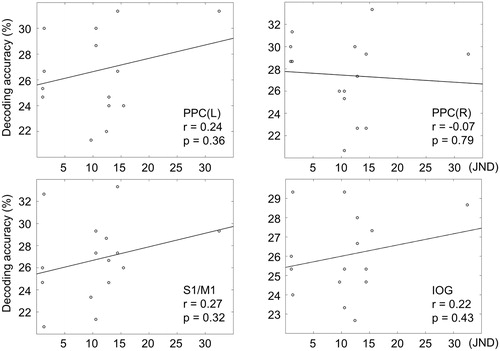
Table 2. Perceptual and neural roughness discriminability for each participant.