
Figures & data
Figure 1. Quantitative thermal stimulating device (VICS, Tokyo) (a) consisting of a controller box (b) and a probe (c). (a) A broader overview of the device, with (b) representing the controller power unit and (c) representing the probe. Electric current to the Peltier element is controlled by a microcomputer in a controller box (b) connected to a PC via serial communication. Probe of the quantitative thermal stimulating device (c).
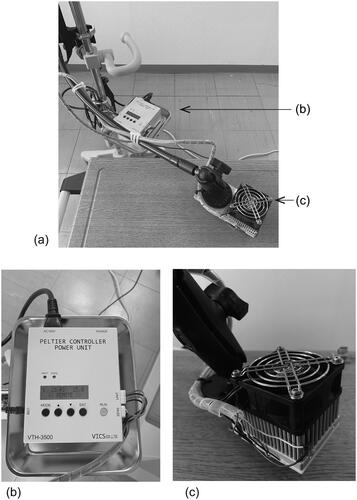
Figure 2. Layout of the PC display for adjusting the parameters of the cold and heat stimuli. (1) The area of the display showing the probe temperature (thick line) and the electronic visual analogue scale (VAS) values for cold stimulation, heat stimulation, and cold–heat pulse stimulation (thin line). (2) The areas of the display indicating the probe temperature. (3) The electronic VAS values for pain assessments. (4) Settings for the p value and I value. (5) Settings for cold and heat stimulation. (6) Settings for cold–heat pulse stimulation.
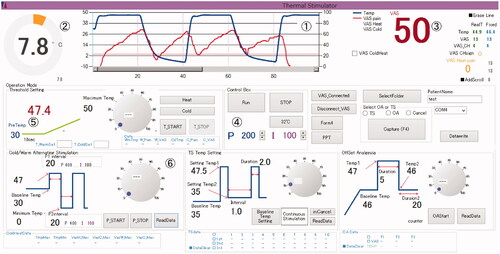
Figure 3. Conditions for the simultaneous application of painful thermal pulse stimulation. (a) Painful cold–heat pulse stimulation (pulse duration: 40 s), with one quantitative thermal stimulator device (device 1; A: hatched square) applied 5 cm from the fossa of the non-dominant forearm (site 1) (condition 1, control). Conditions with two quantitative thermal stimulator devices (devices 1 and 2; B or C: black square or white square) placed in the following locations: (1) on the non-dominant forearm, 5 cm apart (site 2) (condition 2, ipsilateral segmental integration); (2) on the non-dominant forearm and ipsilateral thigh (site 3) (condition 3, extra-segmental integration); and (3) on the bilateral forearms (site 4) (condition 4, contralateral segmental integration). Quantitative thermal stimulator devices were positioned 5 cm from the fossa of the forearm or knee. (b) Wave 1 shows an example of cold–heat pulse stimulation at temperatures of 0 °C and 45 °C, respectively (condition 1). Wave 2 shows an example of painful heat–neutral pulse stimulation (pulse duration: 40 s) at a heat temperature of 45 °C and painful cold–neutral pulse stimulation (pulse duration: 40 s) with a cold temperature of 0 °C. The neutral temperature was set at 32 °C (conditions 2, 3 and 4). Subjective sensations were assessed via open questioning for every 20 s interval. Devices 1 and 2 were randomly assigned as B or C.
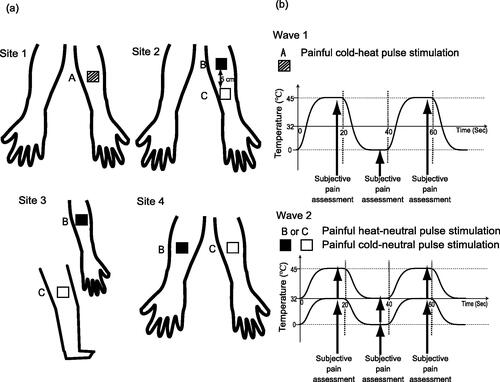
Figure 4. Timeline of the study. In the test session, assessment of temperatures for the cold and heat stimuli were conducted in a random order using a quantitative thermal stimulator device (device 1) 10 min apart (decision period). The painful thermal pulse stimulation sequence (pulse period) was initiated 30 min after the decision period. Subjective sensations were assessed via open questioning after evaluating the temperatures for the cold and heat stimuli during the decision period and for every 20-s interval in the pulse period (total duration of 5 min). The order of the four conditions (condition 1, condition 2, condition 3 and condition 4) was randomly assigned, with a 20 min break between conditions. The pain intensity resulting from painful thermal pulse stimulation was rated continuously using the electronic visual analogue scale (VAS). In the control session, a neutral temperature (32 °C) was applied and the same protocol was performed. C or H: Assessment of temperature for cold and heat stimuli, VAS: visual analogue scale. C1 (condition 1, control): One quantitative thermal stimulator device was placed on the non-dominant forearm. C2 (condition 2, ipsilateral segmental integration): Two quantitative thermal stimulator devices were placed on the non-dominant forearm, 5 cm apart. C3 (condition 3, extra-segmental integration): Two quantitative thermal stimulator devices were placed on the non-dominant forearm and ipsilateral thigh. C4 (condition 4, contralateral segmental integration): Two quantitative thermal stimulator devices were placed on the bilateral forearms.
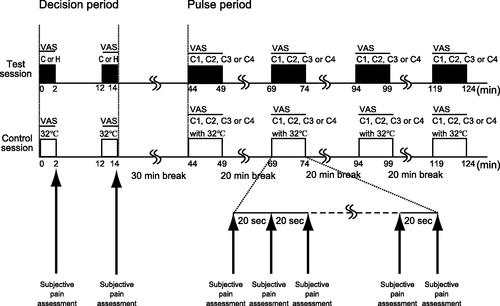
Table 1. The peak temperatures for the cold and heat stimuli in conditions 1–4 in the test and control sessions (pulse period).
Table 2. The VAS values for the cold and heat stimuli in conditions 1–4 in the test and control sessions (pulse period).
Table 3. Numbers and percentages of subjects who experienced the thermal pain illusion.
Data availability statement
The data that support the findings of this study are available from the corresponding author (Yuka Oono) upon reasonable request.