1,598
Views
12
CrossRef citations to date
0
Altmetric
Original

Increased secretion of salivary glands produced by facial vibrotactile stimulation

, , , &
Pages 222-229 | Received 04 Mar 2008, Accepted 03 Nov 2008, Published online: 10 Jul 2009

Figures & data

Figure 1. Apparatus for vibrotactail stimulation. (a) Vibrotactail exciter, vibrotactailal motor, oscillating body and locus of control. (b) Expanded oscillating body.
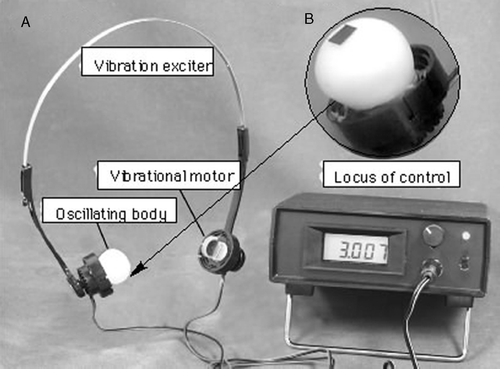
Figure 1. Apparatus for vibrotactail stimulation. (a) Vibrotactail exciter, vibrotactailal motor, oscillating body and locus of control. (b) Expanded oscillating body.

Figure 2. Design chart in locus of control.

Figure 2. Design chart in locus of control.

Figure 3. Analytical curve of oscillator (a) and changes in temperature of the vibrotactailal motor and oscillating body (b).
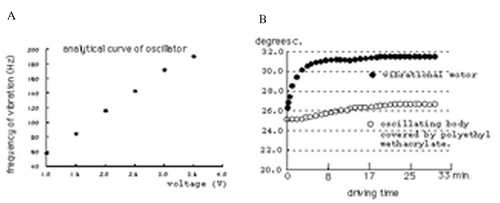
Figure 3. Analytical curve of oscillator (a) and changes in temperature of the vibrotactailal motor and oscillating body (b).

Table I.  Difference from the right and left sides in parotid or submandibular & sublingual gland.

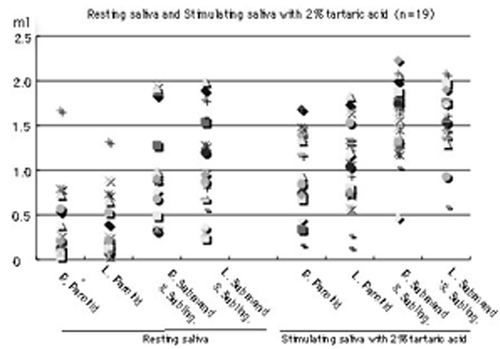
Figure 4. Resting saliva and stimulating saliva with 2% tartaric acid in each subject (n = 19).

Figure 4. Resting saliva and stimulating saliva with 2% tartaric acid in each subject (n = 19).

Figure 5. Averages and standard deviation of resting saliva and stimulating saliva with 2% tartaric acid in each gland.
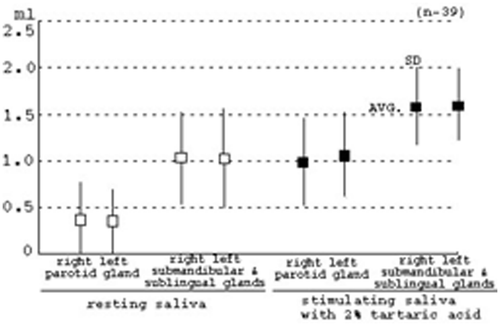
Figure 5. Averages and standard deviation of resting saliva and stimulating saliva with 2% tartaric acid in each gland.

Figure 6. Examples of typical increased salivation patterns in the parotid and/or submandibular and sublingual glands. (a) Increased salivation in the parotid gland. (b) Increased salivation in the submandibular and sublingual glands. (c) Increased salivation in the parotid, and submandibular and sublingual glands.
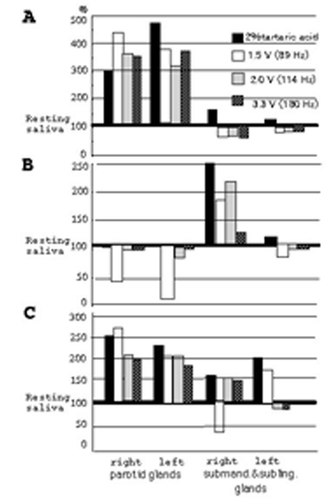
Figure 6. Examples of typical increased salivation patterns in the parotid and/or submandibular and sublingual glands. (a) Increased salivation in the parotid gland. (b) Increased salivation in the submandibular and sublingual glands. (c) Increased salivation in the parotid, and submandibular and sublingual glands.

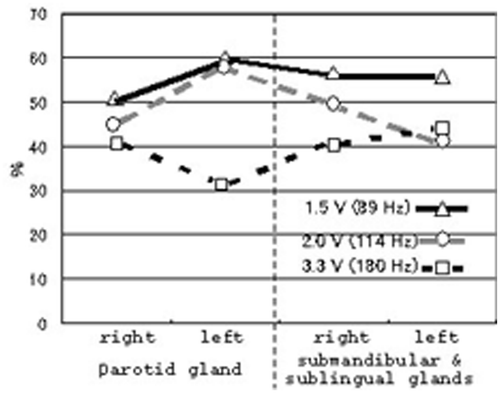
Figure 7. Effects in each gland of each frequency of vibrotactail stimulation.

Figure 7. Effects in each gland of each frequency of vibrotactail stimulation.

Figure 8. The relation between resting and stimulating saliva in the effective vibrotactail. Closed column: values of resting saliva shown by the effective vibrotactail. Open column: values of stimulating saliva in the effective vibrotactail. The relationship between these data carried out test with Paired t-test (*p < 0.05, **p < 0.01).
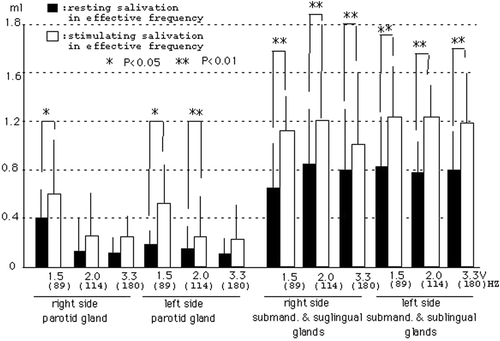
Figure 8. The relation between resting and stimulating saliva in the effective vibrotactail. Closed column: values of resting saliva shown by the effective vibrotactail. Open column: values of stimulating saliva in the effective vibrotactail. The relationship between these data carried out test with Paired t-test (*p < 0.05, **p < 0.01).

Figure 9. Schema of salivation. Arrows in the schema show information flows: somatosensory information evoked by mechanoreceptive stimuli in the oral cavity, arrive at the superior and inferior salivary nucleus, and these information are provided to the parotid, submandibular and sublingual glands by the impetus.
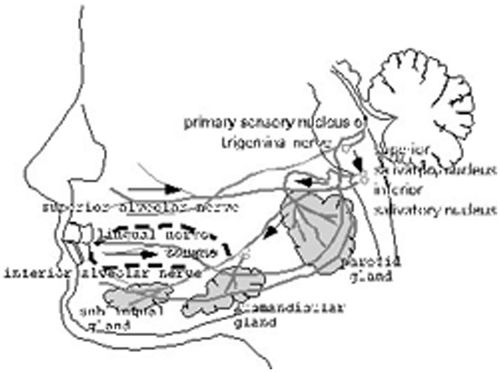
Figure 9. Schema of salivation. Arrows in the schema show information flows: somatosensory information evoked by mechanoreceptive stimuli in the oral cavity, arrive at the superior and inferior salivary nucleus, and these information are provided to the parotid, submandibular and sublingual glands by the impetus.