
Figures & data
Figure 1. System description.
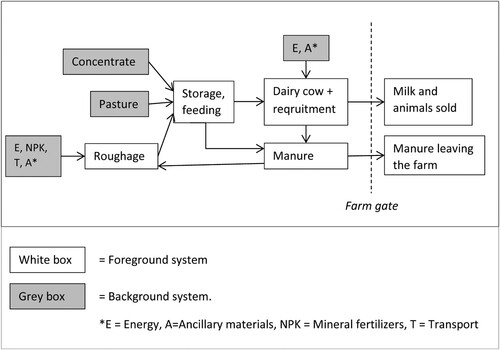
Table 1. Dry matter intake (DMI), proportion of roughage, proportion of feed components in concentrate (% of DMI), and milk yield of dairy cows based on data from a feeding trial (Karlsson et al., Citation2018), recalculated to 305 days of lactation and 60 days of dry period. The treatments differed in type of concentrate
Table 2. Calculated feed intake of different feedstuffs by recruitment heifers, in total kg dry matter (DM), during the rearing period of 27.3 months
Figure 2. Carbon footprint (kg CO2e) of feed composition per kg concentrate: (a) without direct land use change (dLUC) and (b) with dLUC included in the calculations.
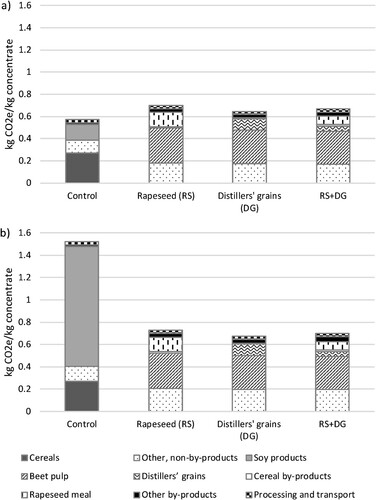
Figure 3. Environmental impact of feed composition per kg concentrate in terms of (a) land requirement (m2), (b) potential eutrophication (g NO3e) and (c) use of non-renewable energy (MJ).
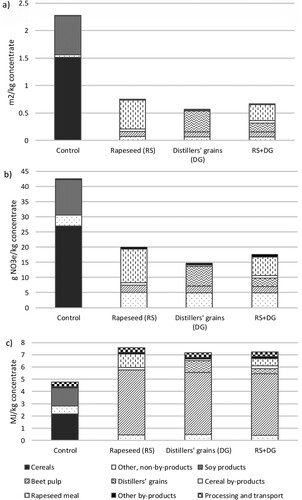
Table 3. Environmental impact per kg ECM (recruitment heifers included), with and without allocation between milk (84%) and meat (16%), divided over different sources, for the environmental categories: (a) carbon footprint (kg CO2e), (b) eutrophication (g NO3e), (c) non-renewable energy use (MJ) and (d) land requirement (m2). For carbon footprint in (a), part I shows results without emissions from land use change and part II shows results with emissions from land use change (dLUC) from soybean and palm oil production. dLUC is calculated according to PAS 2050 (BSI, Citation2012)
Figure 4. Carbon footprint of the feed rations of dairy cows and recruitment heifers, divided into roughage and concentrate, expressed in CO2e per kg energy-corrected milk (ECM).
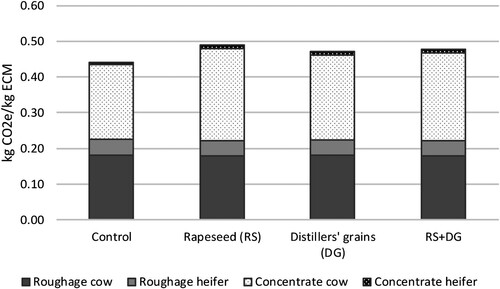
Table 4. Environmental impact of silage production per kg dry matter (DM)
Figure 5. Amount of (a) phosphorus (P) and (b) nitrogen (N) in feed consumed, milk produced and manure excreted per cow and year (excl. heifers) (left axis), and nutrient use efficiency (amount of P and N in milk as % of P and N in feed) (right axis).
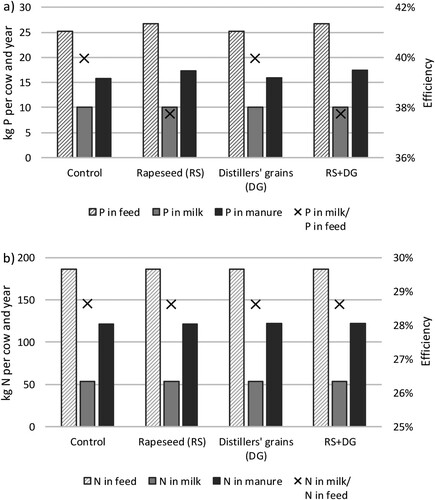
Table 5. Annual cost of feed for dairy cows and heifers, in EUR (1 EUR = 9.633 SEK) per kg energy-corrected milk (ECM) delivered to the dairy plant, assuming silage production on-farm, summer pasture period and purchased concentrate.