Figures & data
Table 1. Comparison of the Official Control (OC), Ask the Cow (AC) and Welfare Quality (WC) protocols in terms of animal-based, management-based and resource-based measures included in assessments on farms with dairy cows.
Table 2. Assessors (A–Y) applying the official control (OC), Ask the Cow (AC) and the Welfare Quality (WQ) protocols on the 41 participating dairy farms (1–41). Number of farms assessed by each assessor is given in brackets.
Figure 1. Correlation between (A) number of remarks in the Official Control (OC) and ranking of the 41 dairy farms using the ‘Ask the Cow’ (AC) protocol (r = 0.40, P = 0.009, y = 2952x + 16,796), (B) number of remarks in OC and ranking using the Welfare Quality (WQ) protocol (P > 0.05) and (C) the AC and WQ rankings. Correlations based on 41 farms, except for WQ (n = 38 farms).
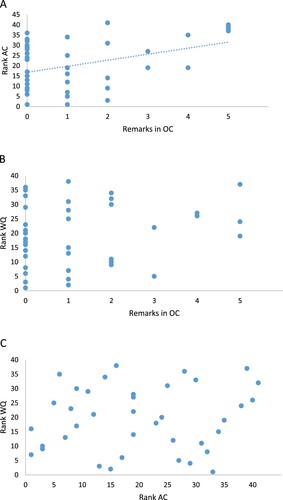
Table 3. Number of negative remarks made about the 41 dairy farms in the Official Control (OC) and farm ranking according to the Ask the Cow (AC) and Welfare Quality (WQ) protocols. There are three missing values for WQ, two since avoidance distance not could be assessed on two farms and one due to missing values, so the total value could not be calculated.
Figure 2. Proportion of lean cows (A) and fat cows (B) per herd in the Ask the Cow (AC) assessment (red bars) and Welfare Quality (WQ) assessment (blue bars). Farm number 1–41 is not related to the ranking.
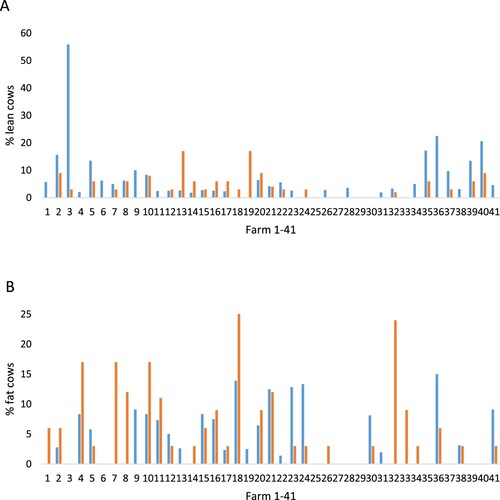
Figure 3. Proportion of (A) dirty cows (blue bars) and severely dirty cows (red bars) per herd in the Ask the Cow (AC) assessment and (B) proportion of cows per herd with dirty legs (blue bars), dirty udder (red bars) and dirty hindquarters (green bars) in the Welfare Quality (WQ) assessment. Farms that received negative remarks in Official Control (OC) are indicated with yellow arrows. Farm number 1–41 is not related to the ranking.
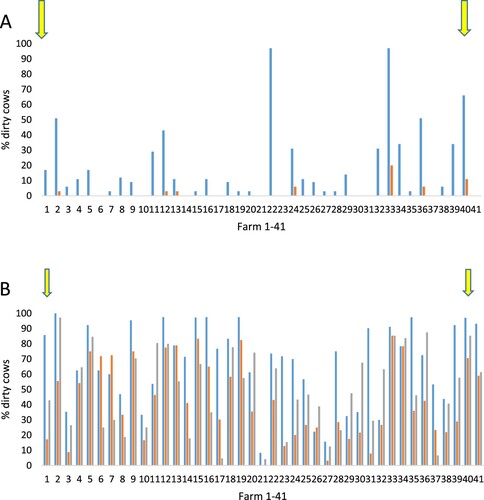
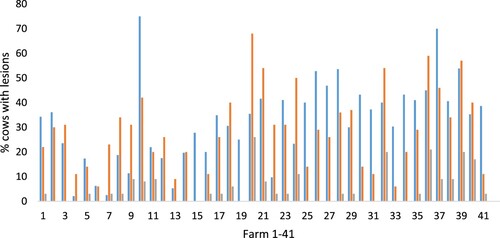
Figure 4. Proportion of cows with skin lesions in the Welfare Quality (WQ) assessment (blue bars) and Ask the Cow (AC) assessment (red bars = skin lesions, green bars = severe skin lesions). Farm number 1–41 is not related to the ranking.