Figures & data
Figure 1. Location of the study area.
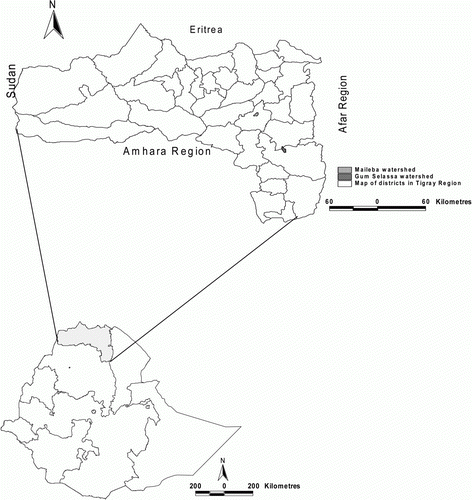
Table I. Mean soil properties (0–20 cm), standard error of means (SEM) and membership values (Q(Xi) of different land uses. OC: Soil organic carbon; N: total nitrogen; C/N: carbon-nitrogen ratio; Pav: available phosphorus; Kav: available potassium; BD: Bulk density; n: number of samples; CL: cultivated land; GL: grazing land; PA: plantation area (Eucalyptus); AE: area exclosure.
Table II. Result of general linear model analysis for major soil properties under four soil depths obtained from different land uses and two sites (p<0.05).
Table III. Results for Tukey paired wise multiple comparison test of soil properties for different land uses and soil depths (p<0.05).
Table IV. Depth- wise distribution of mean (± SEM) of soil properties under different land uses at Maileba and Gum Selassa sites.
Table V. Profile level carbon stocks at different land use types and two sites.
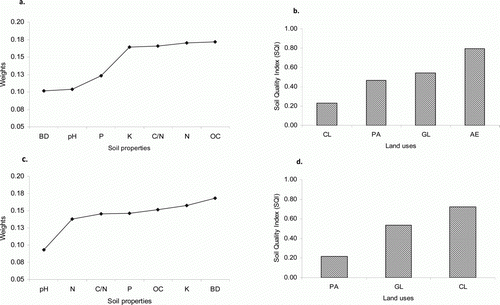
Figure 2. Weight for soil quality indicators (Wi) and soil quality index (SQI) for different land uses at Maileba (a and b) and at Gum Selassa (c and d), respectively. BD: bulk density; pH: soil pH; P: available P; K: available K; C/N: carbon-nitrogen ratio; N: total nitrogen, OC: soil organic carbon; CL: cultivated land; GL: grazing land; PA: plantation area (Eucalyptus); AE: area exclosure.