Figures & data
Figure 1. Representation of the micro-lysimeter used for the stolon establishment experiment.
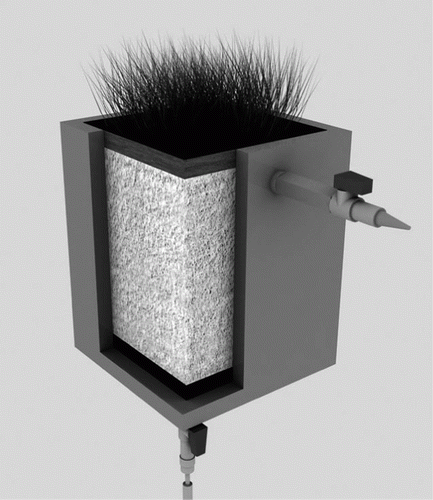
Table I. Total seed germination (%) and T50 (days) of bermudagrass seeds being treated with: 40–20 % [CO2–O2], 40–10 % [CO2–O2], 40–2.5 % [CO2–O2] and [Control]: air.
Figure 2. Cumulative clippings dry weight for plants treated with gas mixtures of 40–20%, 40–10%, 40–2.5% [CO2–O2], and [Control]: air. Bars represent Fisher's least significance difference (LSD) at p = 0.05.
![Figure 2. Cumulative clippings dry weight for plants treated with gas mixtures of 40–20%, 40–10%, 40–2.5% [CO2–O2], and [Control]: air. Bars represent Fisher's least significance difference (LSD) at p = 0.05.](/cms/asset/90b711a4-0be2-4fbf-9885-4916c7699fe9/sagb_a_681058_o_f0002g.gif)
Table II. Leaf chlorophyll content and relative water content of C. dactylon, when the root system was treated with 40–20% [CO2–O2], 40–10% [CO2–O2], 40–2.5% [CO2–O2], and [Control]: air at 7 DGT and 28 DGT.
Table III. Concentration of soluble sugars in C. dactylon leaves, when the root system was treated with 40–20% [CO2–O2], 40–10% [CO2–O2], 40–2.5% [CO2–O2], and [Control]: air at 7 DGT and 28 DGT.
Figure 3. Root growth parameters for plants treated with gas mixtures of 40–20%, 40–10%, 40–2.5% [CO2–O2], and [Control]: air. Bars represent Fisher's least significance difference at p = 0.05. A: Root Dry Weight, B: Root total length and C: Root total area.
![Figure 3. Root growth parameters for plants treated with gas mixtures of 40–20%, 40–10%, 40–2.5% [CO2–O2], and [Control]: air. Bars represent Fisher's least significance difference at p = 0.05. A: Root Dry Weight, B: Root total length and C: Root total area.](/cms/asset/107f7e7e-0b7c-405c-a4d7-e278d5ea53a5/sagb_a_681058_o_f0003g.gif)