Figures & data
Figure 1. Mean weekly temperature (°C; straight line) and mean weekly global radiation per day (MJ m−2 day−1; dashed line) during the experimental period in a) 2008 and b) 2009 at Bioforsk research station, Landvik, Norway, and the N fertilization curve at 100% level for creeping bentgrass (kg N 100 m−2 week−1; dotted line). The grey dotted line in (b) shows the planned fertilization curve, which was deviated from due to reduced plant growth. Dates above the triangles show the sampling dates.
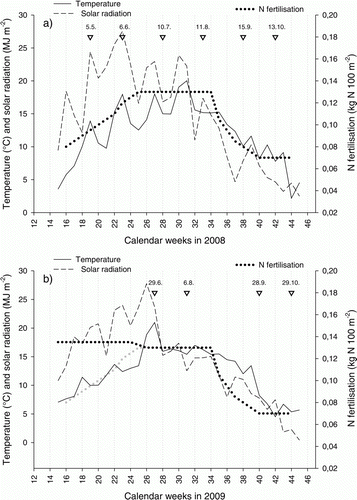
Table I. Nutrient proportions by weight (N = 100) in the liquid fertilizer (Wallco 51-10-43 + microa).
Table II. Ranking order with regard to nitrogen (N) requirement at maximum growth rate (Ericsson et al. Citation2012) and amount of N (kg N per 100 m−2 yr−1) supplied to the different turf grass species at the three intensity levels of N supply tested (100%, 60% and 40% of the N requirement at maximum growth).
Figure 2. Daily growth (bars) and leaf N concentration (dots) in fescues (a, c, mean of chewings fescue and slender creeping red fescue) and bentgrasses (b, d, mean of colonial bentgrass, velvet bentgrass and creeping bentgrass) grown at three fertilization intensities (40% (white), 60% (grey) and 100% (black) of the N requirement at maximum growth) during 2008 and 2009. Dashed horizontal lines represent the lowest leaf N concentration range associated with healthy looking turf.
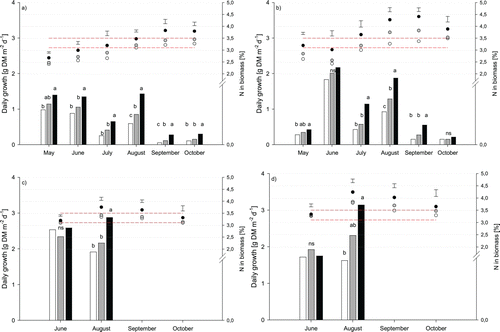
Table III. Nitrogen productivity, i.e. slope of the regression between quantity of clippings and the corresponding leaf N concentration in fescues (chewings fescue (Fch) and slender creeping red fescue (Fcr)) and bentgrasses (creeping bentgrass (Bcr), colonial bentgrass (Bco) and velvet bentgrass (Bve)) during 2008 and 2009.
Figure 3. Content of fructans in dry matter of clippings in (a) June, (b) August and (c) September 2009 for chewings fescue (Fch), slender creeping red fescue (Fcr), colonial bentgrass (Bco), velvet bentgrass (Bve) and creeping bentgrass (Bcr) grown at three fertilization intensities (40% (white), 60% (grey) and 100% (black) of the N requirement at maximum growth). Significances (Tukey's test): *, **, *** at p < 0.05, 0.01 and 0.001 level, respectively; ns = not significant.
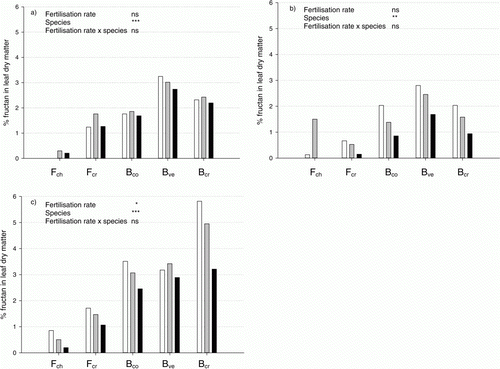
Figure 4. Ball roll in response to fertilization intensity (40% (white), 60% (grey) and 100% (black) of the N requirement at maximum growth) on a green with a turf cover consisting of chewings fescue (Fch), slender creeping red fescue (Fcr), colonial bentgrass (Bco), velvet bentgrass (Bve) and creeping bentgrass (Bcr). Mean of three measurements (4 Aug., 19 and 27 Sept.) in 2009. Significances (Tukey's test): *, **, *** at p < 0.05, 0.01 and 0.001 level, respectively; ns = not significant.
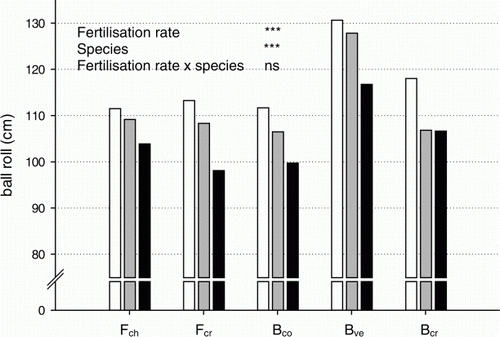
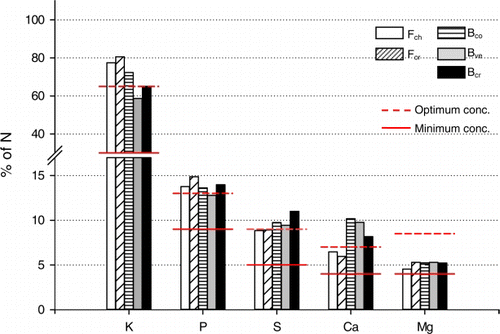
Figure 5. Proportions by weight relative to nitrogen content (N = 100) of potassium (K), phosphorus (P), sulphur (S), calcium (Ca) and magnesium (Mg) in clippings from chewings fescue (Fch), slender creeping red fescue (Fcr), colonial bentgrass (Bco), velvet bentgrass (Bve) and creeping bentgrass (Bcr) collected in August 2009. Means of three fertilization regimes (40%, 60% and 100% of the N requirement at maximum growth). The upper dotted horizontal lines represent the leaf macronutrient proportions associated with non-limiting nutrient conditions. The lower solid lines represent the lowest possible proportion for achievement of maximum growth.