Figures & data
Table I. Particle size distribution of the sand used in the experiment.
Table II. Saturated hydraulic conductivity and water retention characteristics (according to ASTM, F 1815-06) of individual mixes used for the experiment (standard deviation values are presented for the saturated hydraulic conductivity values due to more variable nature of this test method).
Table III. Water retention (cm3 cm−3) at −4 kPa, −1500 kPa (PWP) and available water (AW) of a variety of amendment materials at recommended incorporation rates (standard deviations values are included when only two repetitions were used).
Table IV. Volumetric water content (cm3 cm−3) in top 60 mm of the profile, measured using a Theta probe as the rootzones mixes drain under gravity with amendments incorporated at recommended rates and in pure sand.
Table V. Effect of amendment rate in the lower rootzone layer (150–300 mm) on selected surface properties (values averaged for all amendments and incorporation rates).
Figure 1. The differences in shear strength among used materials (pure sand = 5.0 kPa = 100); vertical bars show the confidence limits at p=0.05.
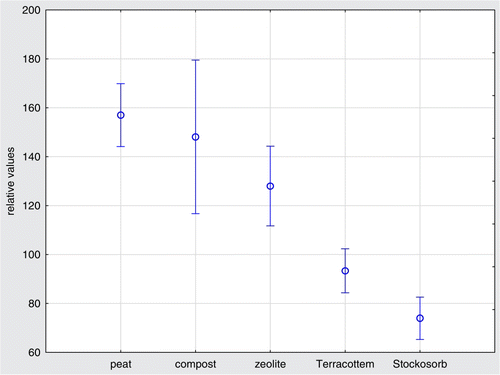
Figure 2. The differences in hardness among the used materials (pure sand = 59 gravities = 100%); Vertical bars show the confidence limits at p=0.05.
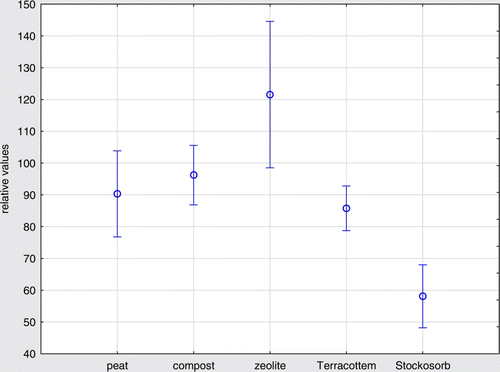
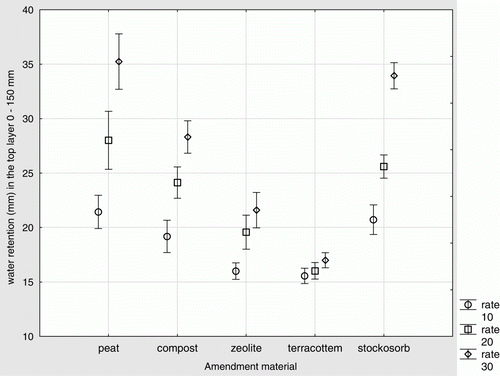
Figure 3. Effect of amendment materials and incorporation rate on water retention (mm) in the upper layer of rootzone (0–150 mm), vertical lines show the confidence limits at p=0.05; water retention of pure sand layer was 14.6±s.d. 0.46. For Stockosorb and TerraCottem rate 10 means 0.5 recommended rate (RR), rate 20 = 1.0 RR and rate 30 = 1.5 RR.