Figures & data
Table I. Treatment plan from May to October 2008.
Figure 1. Response of Lolium perenne as a function of propane dose (kg ha−1) and number of flamings per year. (A) Response was measured as plant dry weight, (B) percentage green cover estimated by image analysis and (C) percentage green cover estimated by visual assessment on images. Each bar corresponds to the mean of nine replicates (three per block, 18 replicates for control plants (six per block).
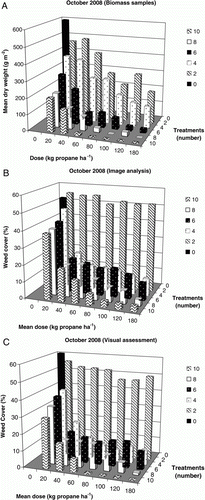
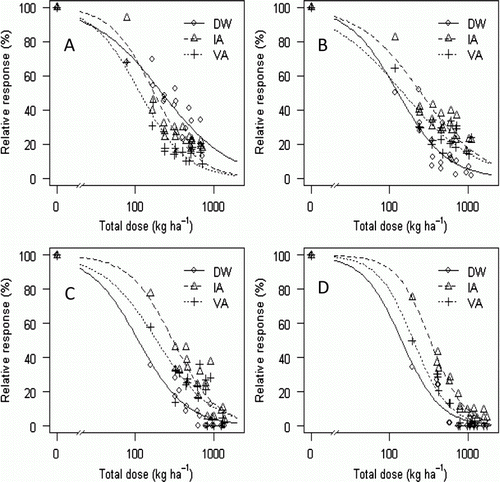
Table II. Equation parameters (model 2) and standard errors (SE) of the effect of flame treatment on perennial ryegrass after different number of treatments per year.
Figure 2. Dose–response curves for the total propane dose effect on relative plant dry weight or plant cover after flaming of perennial ryegrass with different number of treatments per year. (A) 4 Treatments per year, (B) 6 treatments per year, (C) 8 treatments per year and (D) 10 treatments per year. Each data point corresponds to the mean of nine samples. The upper asymptote (control plants) is based on the mean from 18 samples. Parameter estimates are given in . The total dose requirement was assessed by three different methods: Plant dry weight (DW), weed cover assessed by image analysis (IA) or visual assessment (VA).