803
Views
8
CrossRef citations to date
0
Altmetric
ORIGINAL ARTICLES

Agricultural drainage in Lithuania: a review of practices and environmental effects

, , , , , , , , & show all
Pages 14-29 | Received 02 Jun 2014, Accepted 25 Sep 2014, Published online: 27 Mar 2015

Figures & data

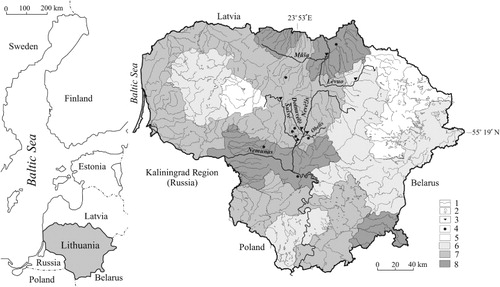
Figure 1. Map of Lithuania, showing the location of the studied rivers and drainage research sites mentioned in the analysis. (Symbols in the legend: 1 – rivers and streams; 2 – lakes; 3 – river water monitoring site; 4 – drainage water monitoring site; 5–8 – percentage distribution of drained agricultural area: 5 – below 65%; 6 – 65%–75%; 7 – 75%–85%; 8 – over 85%).
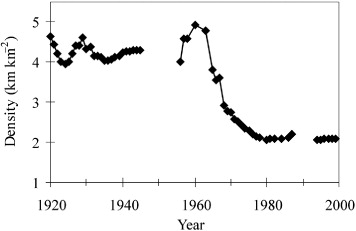
Figure 2. Overall ditch density in drained area (Povilaitis Citation2001).
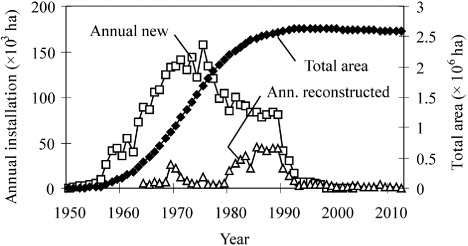
Figure 3. The dynamics of the installation of subsurface drainage systems (Povilaitis et al. Citation2011).
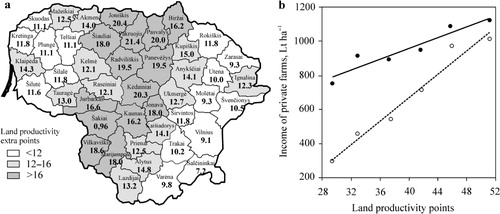
Figure 4. Land productivity extra points gained due to drainage in different Lithuanian administrative districts (a); and the relationship between common income (black dots) and the income from crop cultivation (hollow dots) against land productivity points (b).
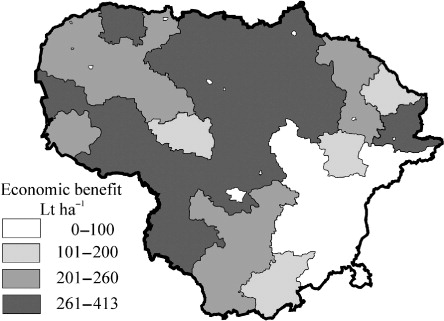
Figure 5. Zones of economic benefit due to land drainage.
Figure 6. Seasonal distribution of mean air temperature (left) and tile-drainage run-off (right) from 1969 to 2009.

Table 1. Average annual leaching of nutrients (kg ha−1) via drainage systems from various cropping systemsa on gleic cambisols between 1995 and 2003 (Bučienė et al. Citation2007).

Table 2. Studies reporting N and P leaching via subsurface drainage systems from fields receiving slurry and liquid manure.
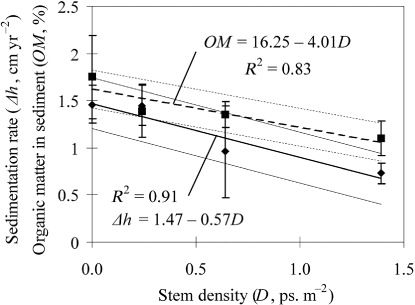
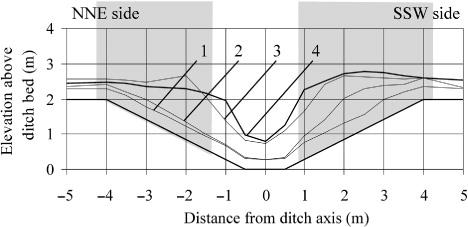
Figure 7. Dependence of sedimentation rate (Δh, diamonds) and sediment organic matter percentage (OM, squares) in ditches on the density of slope woody vegetation (D). ‘Antennae’ mark SE and thin solid and dotted lines mark the confidence bounds of regressions at p = 0.05 (Lamsodis, Morkūnas et al. Citation2006).
Figure 8. Snowdrift profiles formed in the Pakruostė-4 ditch in 1996. 1–4 – profiles measured on 22 January, 14 February and 6 and 20 March; grey fields mark rough spaces overgrown by trees; stem density averages 1.2 ps. m–2; height of trees averages 5.4 m over upper edges of slopes (Vaikasas & Lamsodis Citation2007).
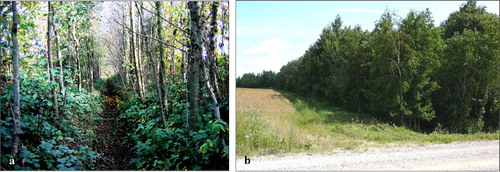
Figure 9. Two views of the same stretch of Graisupis-1 ditch demonstrating: (a) suppressing effect of trees 12 years after planting on growth of bed vegetation, taken in 2005 (photo: V. Poškus); and (b) field shelterbelt formed over ditch channel over 16 years, taken in 2009 (photo: R. Lamsodis).

Reprints and Corporate Permissions

Please note: Selecting permissions does not provide access to the full text of the article, please see our help page How do I view content?

To request a reprint or corporate permissions for this article, please click on the relevant link below:

Academic Permissions

Please note: Selecting permissions does not provide access to the full text of the article, please see our help page How do I view content?

Obtain permissions instantly via Rightslink by clicking on the button below:

If you are unable to obtain permissions via Rightslink, please complete and submit this Permissions form. For more information, please visit our Permissions help page.