Figures & data
![Figure 1. Topographical map of the study area with the ditch evaluated shown as a blue line and the catchment area of the ditch marked with a black line.](/cms/asset/f1825a92-b72b-41df-840e-58504ca38c2b/sagb_a_996589_f0001_oc.jpg)
![Figure 2. The ditch evaluated (blue line), with the letters A, B, C, D, E and F showing the end of each ditch section. The arrow shows the flow direction.](/cms/asset/8099d832-bcb2-446f-ae89-c0b3fa1db923/sagb_a_996589_f0002_oc.jpg)
![Figure 3. The ditch evaluated (blue line), with the letters A, B, C, D, E and F showing the end of each ditch section. The selected figures show changes over time in the ditch cross section, with the blue lines representing the original cross section and the red lines the observed cross section. The scales are in cm.](/cms/asset/7328b432-536c-448a-8b2a-c7afee711521/sagb_a_996589_f0003_oc.jpg)
Table 1. Results of the ditch assessment in six segments with total MADRAS scores.
![Figure 4. Changes in land use in the ditch catchment area between 1952 and 2012, and the expected land use change by 2020. In the legend Settlements 1 are areas with houses with green areas in between them, Settlements 2 are building areas with sparse or no green areas in between them and New Settlements are planned settlements.](/cms/asset/960e62b3-56df-497d-896c-3d96fe6a7af6/sagb_a_996589_f0004_oc.jpg)
![Figure 5. (a) Schematic presentation of the geographical location of flow accumulation points 1–5 and the calculated water flow in each point and (b) measured cross-section placements with the higher number upstream and the lowest number at the outlet.](/cms/asset/69c1cff2-9898-49a5-882e-2f2a7c01d216/sagb_a_996589_f0005_oc.jpg)
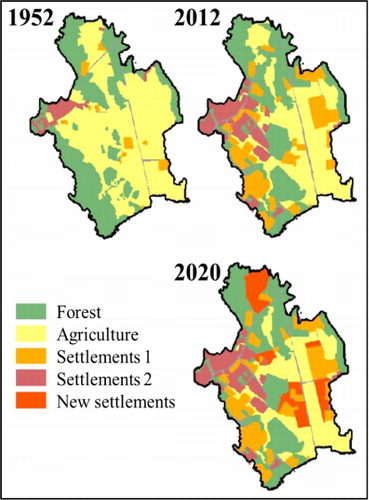
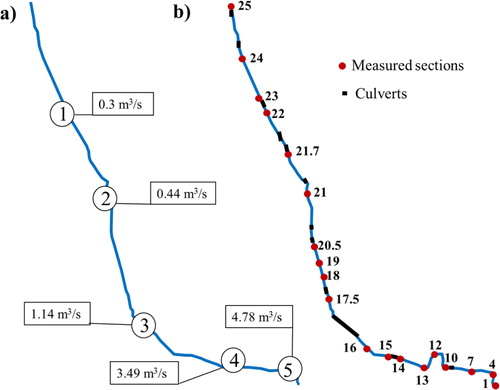
Table 2. Calculated flows in relation to the land use of 1952, 2012 and 2020 at different accumulation points.
![Figure 6. Output of one selected HEC-RAS simulation showing the consequences of damming one culvert (light blue area indicates water). (a) The water level over the bank level in the ditch cross-section upstream from the culvert. (b) The overfill culvert on the upstream side. (c) The water level in the cross-section downstream from the culvert. (d) The water level in the culvert downstream side.](/cms/asset/807f1fd0-53a5-44cd-859c-a1473f94dbc6/sagb_a_996589_f0006_oc.jpg)
Register now or learn more
Free access
Please note: Selecting permissions does not provide access to the full text of the article, please see our help page How do I view content?
To request a reprint or corporate permissions for this article, please click on the relevant link below:
Please note: Selecting permissions does not provide access to the full text of the article, please see our help page How do I view content?
Obtain permissions instantly via Rightslink by clicking on the button below:
If you are unable to obtain permissions via Rightslink, please complete and submit this Permissions form. For more information, please visit our Permissions help page.
People also read lists articles that other readers of this article have read.
Recommended articles lists articles that we recommend and is powered by our AI driven recommendation engine.
Cited by lists all citing articles based on Crossref citations.
Articles with the Crossref icon will open in a new tab.