Figures & data
Table 1. Crop rotations and past annual N application rates of urea during 2008–2010 in the field plots.
Figure 1. Effects of six-year past annual N application rates and a catch crop on soil EC, pH, organic C, –N and
–N (means ± SE, n = 3) between an intensive rotation. The p values of past N application rates on soil EC, pH, organic C,
–N and
–N were <.001, <.001, .335, <.001 and <.001. The p values of catch crop on soil EC, pH, organic C,
–N and
–N were .026, .027, .046, <.001 and .015. The p values of interaction between past N application rates and catch crop on soil EC, pH, organic C,
–N and
–N were .323, .018, .769, .001 and .031. N0, N348, N522, N696 and N870 were 0%, 40%, 60%, 80% and 100% of the conventional N rate (300, 270 or 300 kg N ha−1 for tomato, cucumber or celery).
Figure 2. Effects of six-year past annual N application rates and a catch crop on soil microbial AWCD, Shannon index, Simpson index and McIntosh index (means ± SE, n = 4) between an intensive rotation. The p values of past N application rates on AWCD, Shannon index, Simpson index and McIntosh index were <.001, .009, .087 and <.001. The p values of catch crop on AWCD, Shannon index, Simpson index and McIntosh index were .286, .302, .625 and .561. The p values of interaction between past N application rates and catch crop on AWCD, Shannon index, Simpson index and McIntosh index were .162, .378, .148 and .259. N0, N348, N522, N696 and N870 were 0%, 40%, 60%, 80% and 100% of the conventional N rate (300, 270 or 300 kg N ha−1 for tomato, cucumber or celery).
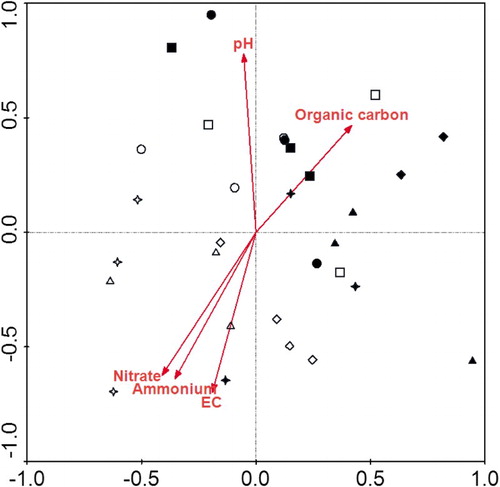
Figure 3. The CCA biplot with the sole carbon source and the following environmental factors: EC, pH, organic C, –N and
–N. N0 (circle), N348 (square), N522 (diamond), N696 (triangle), and N870 (star) were 0%, 40%, 60%, 80% and 100% of the conventional N rate (300, 270 or 300 kg N ha−1 for tomato, cucumber or celery). Hallow symbols denote the no catch crop and solid symbols denote the catch crop.
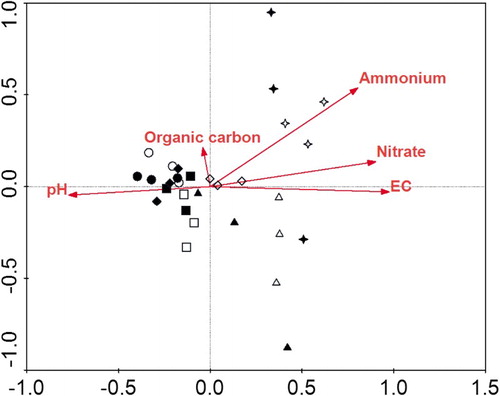
Table 2. CCA of PLFA patterns and CLPP for soil microbial communities.
Figure 4. Effects of six-year past annual N application rates and a catch crop on the amounts (nmol g−1 dry weight soil) of total, bacterial, gram-positive bacterial, gram-negative bacterial, fungal and actinobacterial phospholipids fatty acids (PLFAs) (means ± SE, n = 4) between an intensive rotation. The p values of past N application rates on total, bacterial, gram-positive bacterial, gram-negative bacterial, fungal and actinobacterial PLFAs were .681, .968, .688, .481, .346 and .716. The p values of catch crop on total, bacterial, gram-positive bacterial, gram-negative bacterial, fungal and actinobacterial PLFAs were .020, .104, .088, .160, .083 and .008. The p values of interaction between past N application rates and catch crop on total, bacterial, gram-positive bacterial, gram-negative bacterial, fungal and actinobacterial PLFAs were .074, .125, .636, .352, .333 and .232. N0, N348, N522, N696 and N870 were 0%, 40%, 60%, 80% and 100% of the conventional N rate (300, 270 or 300 kg N ha−1 for tomato, cucumber or celery).
Figure 5. CCA biplot with the microbial fatty FAMEs and the following environmental factors: EC, pH, organic C, –N and
–N. N0 (circle), N348 (square), N522 (diamond), N696 (triangle) and N870 (star) were 0%, 40%, 60%, 80% and 100% of the conventional N rate (300, 270 or 300 kg N ha−1 for tomato, cucumber or celery). Hallow symbols denote the no catch crop and solid symbols denote the catch crop.