689
Views
8
CrossRef citations to date
0
Altmetric
ORIGINAL ARTICLE

Saline water irrigation stimulate N2O emission from a drip-irrigated cotton field

, , , , , , , & show all
Pages 141-152 | Received 21 Apr 2015, Accepted 13 Aug 2015, Published online: 16 Sep 2015

Figures & data

Figure 1. Layout of the experimental plot (inner-row and inter-row) and location of the chambers.

Figure 1. Layout of the experimental plot (inner-row and inter-row) and location of the chambers.

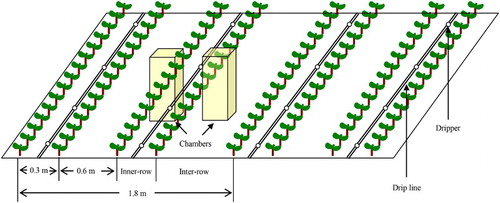
Table 1. The amounts of irrigation water, N fertilizer application rates, and dates of N2O sampling under three water salinity treatments in field experiment (2014).

Figure 2. Changes in soil moisture during one irrigation cycle from 24 June to 29 June (irrigation and N fertigation on 22–23 June). Abbreviations: FW (0.35 dS m−1), BW (4.61 dS m−1), SW (8.04 dS m−1), N0 (unfertilized), and N360 (360 kg N ha−1). Values are the mean of three replicates. Error bars represent SD.

Figure 2. Changes in soil moisture during one irrigation cycle from 24 June to 29 June (irrigation and N fertigation on 22–23 June). Abbreviations: FW (0.35 dS m−1), BW (4.61 dS m−1), SW (8.04 dS m−1), N0 (unfertilized), and N360 (360 kg N ha−1). Values are the mean of three replicates. Error bars represent SD.

Figure 3. Soil moisture content across the growing season (18 June–13 August) as affected by irrigation and N fertigation. Abbreviations: FW (0.35 dS m−1), BW (4.61 dS m−1), SW (8.04 dS m−1), N0 (unfertilized), and N360 (360 kg N ha−1). Values are the mean of three replicates. Error bars represent SD. Solid arrows indicate fertigation events. Dashed arrows indicate irrigation events.

Figure 3. Soil moisture content across the growing season (18 June–13 August) as affected by irrigation and N fertigation. Abbreviations: FW (0.35 dS m−1), BW (4.61 dS m−1), SW (8.04 dS m−1), N0 (unfertilized), and N360 (360 kg N ha−1). Values are the mean of three replicates. Error bars represent SD. Solid arrows indicate fertigation events. Dashed arrows indicate irrigation events.

Figure 4. Changes in soil salinity (EC) during one irrigation cycle from 24 June to 29 June (irrigation and N fertigation on 22–23 June). Abbreviations: FW (0.35 dS m−1), BW (4.61 dS m−1), SW (8.04 dS m−1), N0 (unfertilized), and N360 (360 kg N ha−1). Values are the mean of three replicates. Error bars represent SD.

Figure 4. Changes in soil salinity (EC) during one irrigation cycle from 24 June to 29 June (irrigation and N fertigation on 22–23 June). Abbreviations: FW (0.35 dS m−1), BW (4.61 dS m−1), SW (8.04 dS m−1), N0 (unfertilized), and N360 (360 kg N ha−1). Values are the mean of three replicates. Error bars represent SD.

Figure 5. Soil salinity (EC) across the growing season (18 June to 13 August) as affected by irrigation and N fertigation. Abbreviations: FW (0.35 dS m−1), BW (4.61 dS m−1), SW (8.04 dS m−1), N0 (unfertilized), and N360 (360 kg N ha−1). Values are the mean of three replicates. Error bars represent SD. Solid arrows indicate fertigation events. Dashed arrows indicate irrigation events.

Figure 5. Soil salinity (EC) across the growing season (18 June to 13 August) as affected by irrigation and N fertigation. Abbreviations: FW (0.35 dS m−1), BW (4.61 dS m−1), SW (8.04 dS m−1), N0 (unfertilized), and N360 (360 kg N ha−1). Values are the mean of three replicates. Error bars represent SD. Solid arrows indicate fertigation events. Dashed arrows indicate irrigation events.

Figure 6. Changes in soil pH during one irrigation cycle from 24 June to 29 June (irrigation and N fertigation on 22–23 June). Abbreviations: FW (0.35 dS m−1), BW (4.61 dS m−1), SW (8.04 dS m−1), N0 (unfertilized), and N360 (360 kg N ha−1). Values are the mean of three replicates. Error bars represent SD.

Figure 6. Changes in soil pH during one irrigation cycle from 24 June to 29 June (irrigation and N fertigation on 22–23 June). Abbreviations: FW (0.35 dS m−1), BW (4.61 dS m−1), SW (8.04 dS m−1), N0 (unfertilized), and N360 (360 kg N ha−1). Values are the mean of three replicates. Error bars represent SD.

Figure 7. Soil pH across the growing season (18 June to 13 August) as affected by irrigation and N fertigation. Abbreviations: FW (0.35 dS m−1), BW (4.61 dS m−1), SW (8.04 dS m−1), N0 (unfertilized), and N360 (360 kg N ha−1). Values are the mean of three replicates. Error bars represent SD. Solid arrows indicate fertigation events. Dashed arrows indicate irrigation events.

Figure 7. Soil pH across the growing season (18 June to 13 August) as affected by irrigation and N fertigation. Abbreviations: FW (0.35 dS m−1), BW (4.61 dS m−1), SW (8.04 dS m−1), N0 (unfertilized), and N360 (360 kg N ha−1). Values are the mean of three replicates. Error bars represent SD. Solid arrows indicate fertigation events. Dashed arrows indicate irrigation events.

Figure 8. Changes in soil and  concentrations during one irrigation cycle from 24 June to 29 June (irrigation and N fertigation on 22–23 June). Abbreviations: FW (0.35 dS m−1), BW (4.61 dS m−1), SW (8.04 dS m−1), N0 (unfertilized), and N360 (360 kg N ha−1). Values are the mean of three replicates. Error bars represent SD.

Figure 8. Changes in soil and  concentrations during one irrigation cycle from 24 June to 29 June (irrigation and N fertigation on 22–23 June). Abbreviations: FW (0.35 dS m−1), BW (4.61 dS m−1), SW (8.04 dS m−1), N0 (unfertilized), and N360 (360 kg N ha−1). Values are the mean of three replicates. Error bars represent SD.

Figure 9. Soil and concentrations across the growing season (18 June to 13 August) as affected by irrigation and N fertigation. Abbreviations: FW (0.35 dS m−1), BW (4.61 dS m−1), SW (8.04 dS m−1), N0 (unfertilized), and N360 (360 kg N ha−1). Values are the mean of three replicates. Error bars represent SD. Solid arrows indicate fertigation events. Dashed arrows indicate irrigation events.

Figure 9. Soil and concentrations across the growing season (18 June to 13 August) as affected by irrigation and N fertigation. Abbreviations: FW (0.35 dS m−1), BW (4.61 dS m−1), SW (8.04 dS m−1), N0 (unfertilized), and N360 (360 kg N ha−1). Values are the mean of three replicates. Error bars represent SD. Solid arrows indicate fertigation events. Dashed arrows indicate irrigation events.

Figure 10. Changes in soil N2O emission flux during one irrigation cycle from 24 June to 29 June (irrigation and N fertigation on 22–23 June). Abbreviations: FW (0.35 dS m−1), BW (4.61 dS m−1), SW (8.04 dS m−1), N0 (unfertilized), and N360 (360 kg N ha−1). Values are the mean of three replicates. Error bars represent SD.

Figure 10. Changes in soil N2O emission flux during one irrigation cycle from 24 June to 29 June (irrigation and N fertigation on 22–23 June). Abbreviations: FW (0.35 dS m−1), BW (4.61 dS m−1), SW (8.04 dS m−1), N0 (unfertilized), and N360 (360 kg N ha−1). Values are the mean of three replicates. Error bars represent SD.

Figure 11. Soil N2O emission flux across the growing season (18 June to 13 August) as affected by irrigation and N fertigation. Abbreviations: FW (0.35 dS m−1), BW (4.61 dS m−1), SW (8.04 dS m−1), N0 (unfertilized), and N360 (360 kg N ha−1). Values are the mean of three replicates. Error bars represent SD. Solid arrows indicate fertigation events. Dashed arrows indicate irrigation events.

Figure 11. Soil N2O emission flux across the growing season (18 June to 13 August) as affected by irrigation and N fertigation. Abbreviations: FW (0.35 dS m−1), BW (4.61 dS m−1), SW (8.04 dS m−1), N0 (unfertilized), and N360 (360 kg N ha−1). Values are the mean of three replicates. Error bars represent SD. Solid arrows indicate fertigation events. Dashed arrows indicate irrigation events.

Table 2. Correlation between soil N2O emission rate and selected soil properties (n = 72).

Figure 12. Effects of irrigation water salinity and N rate on cumulative N2O emission. Error bars indicate the standard error of the mean (n = 3). Bars with different letters are significantly different at p < .05 (Duncan's Least significant difference test).

Figure 12. Effects of irrigation water salinity and N rate on cumulative N2O emission. Error bars indicate the standard error of the mean (n = 3). Bars with different letters are significantly different at p < .05 (Duncan's Least significant difference test).

Reprints and Corporate Permissions

Please note: Selecting permissions does not provide access to the full text of the article, please see our help page How do I view content?

To request a reprint or corporate permissions for this article, please click on the relevant link below:

Academic Permissions

Please note: Selecting permissions does not provide access to the full text of the article, please see our help page How do I view content?

Obtain permissions instantly via Rightslink by clicking on the button below:

If you are unable to obtain permissions via Rightslink, please complete and submit this Permissions form. For more information, please visit our Permissions help page.