Figures & data
Figure 1. The number of bacterial (a) and fungal (b) operational taxonomic unit (OTU) number in the apple orchard soils intercropped with different forage species, as well as in that with no vegetation, that is, clean tillage. (Apple trees intercropped with NG, RC, and RE; CT, clean tillage in the apple orchard).
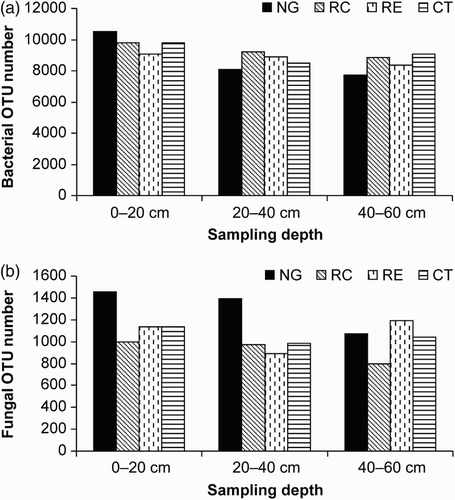
Figure 2. Relative abundances of different bacterial (a) and fungal (b) genera in the apple orchard soils intercropped with different forage species, as well as in that with no vegetation (clean tillage). (Apple trees intercropped with NG, RC, and RE; CT, clean tillage in the apple orchard; 1, 2, and 3 represent soils at depths of 0–20 cm, 20–40 cm, and 40–60 cm, respectively).
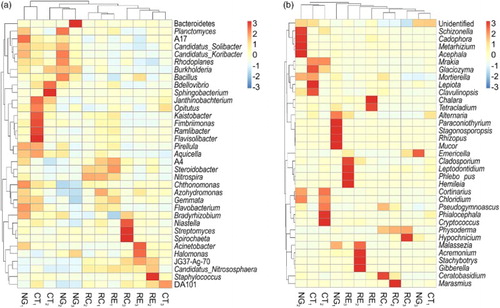
Figure 3. Relative abundances of different bacterial (a) and fungal (b) classes in the apple orchard soils intercropped with different forage species, as well as in that with no vegetation (clean tillage). (Apple trees intercropped with NG, RC, and RE; CT, clean tillage in the apple orchard; 1, 2, and 3 represent soil depths of 0–20 cm, 20–40 cm, and 40–60 cm, respectively).
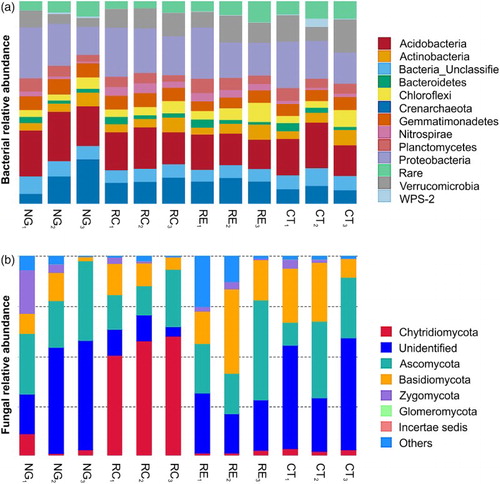
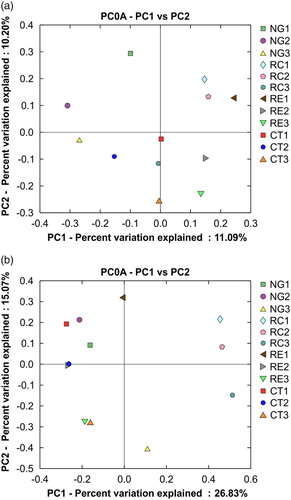
Figure 4. Principal coordinate analysis of bacterial (a) and fungal (b) communities in the apple orchard soils intercropped with different forage species, as well as in that with no vegetation (clean tillage). (Apple trees intercropped with NG, RC, and RE; CT, clean tillage in the apple orchard; 1, 2, and 3 represent soil depths of 0–20 cm, 20–40 cm, and 40–60 cm, respectively.