Figures & data
Figure 1. Setup of Percostation and sensors (Ader LLC) in May, 2013 (photo by E. Reintam).
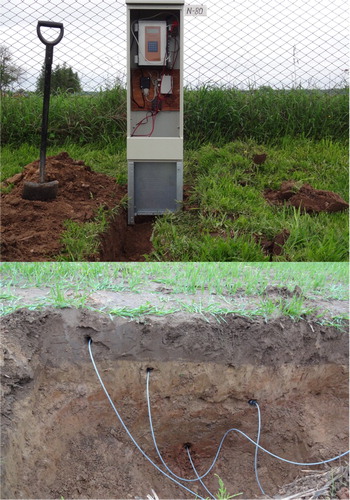
Table 1. Average soil properties and standard error of the values of the experimental site.
Figure 2. Measured soil volumetric water content (%, by Percostation) in different depths under field (Hordeum vulgare L.) and grassland, precipitations (mm) and calculated evapotranspiration by Alpatjev in 2013.
Figure 3. Measured soil volumetric water content (%, by Percostation) at different depths under field (Solanum tuberosum L.) and grassland, precipitations (mm) and calculated evapotranspiration by Alpatjev in 2014.
Figure 4. The correlation between measured and predicted soil volumetric moisture content (%) of upper 25 cm (average) of soil as an average of two years using the 2 h and daily step under cultivated (field) and grassland conditions. For daily predictions correlation is statistically significant (p < .05).