Figures & data
Table 1. Weather data during the two spring wheat growing seasons in 2013 and 2014 recorded at the climate station of the experimental farm of University of Copenhagen within 3 km of the two field trial sites.
Figure 1. Above-ground dry biomass of spring wheat genotypes in the plots of single plants during the early growth stages in 2013. Values are means ± standard error (SE).
Figure 2. Grain yield of spring wheat genotypes grown under standard density in 2013 and 2014. Values are means ± SE.
Figure 3. Relationship between above-ground (left) and root dry biomass (right) of single plants at early growth stages and the yield of spring wheat plants grown under standard density in the different soil fertility treatments in 2013. r denotes Pearson correlation coefficients, and * significance at P < .05.
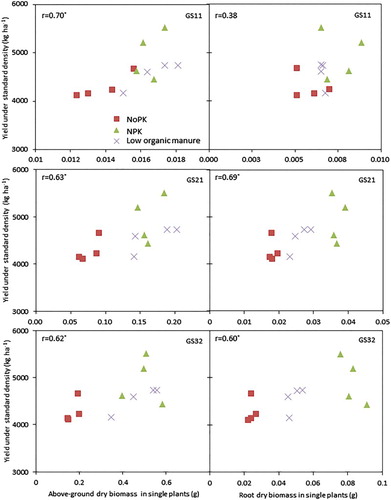
Figure 4. Relationship between NDVI at early growth stages and the harvested yield of spring wheat grown in 2014 in the different soil fertility management treatments. r denotes Pearson correlation coefficients, and ** significance at P < .01.
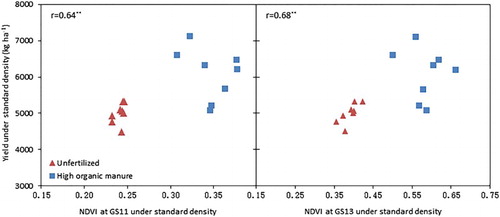
Figure 5. Grain N and P accumulation of spring wheat genotypes grown under standard density in 2013 (N) and 2014 (N and P). Values are means ± SE.