Figures & data
Figure 1. Bagrot valley, Central Karakoram National Park, Gilgit-Baltistan, Pakistan.
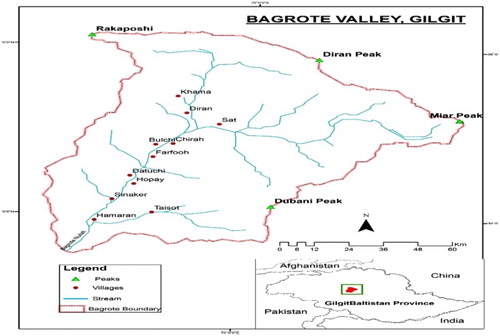
Figure 2. Variation Soil bulk density, SOC (%) and SOCS (Mg/Ha) across different land uses in various depths. Values having the same letter do not differ significantly from each other with respect to land uses and depth at p ≤ 0.05. Letters x, y, z indicate the variation within land uses in different depths, while, letters a, b, c indicate the variation among the land uses in each depth. Abbreviation BD (bulk density); SOC (soil organic carbon) and SOCS (soil organic carbon stock).
Table 1. Effect of land uses on soil BD (g cm−3) and SOC (%) and stock in different depth.
Figure 3. Relationship of soil organic carbon stock with different variable in arable land.
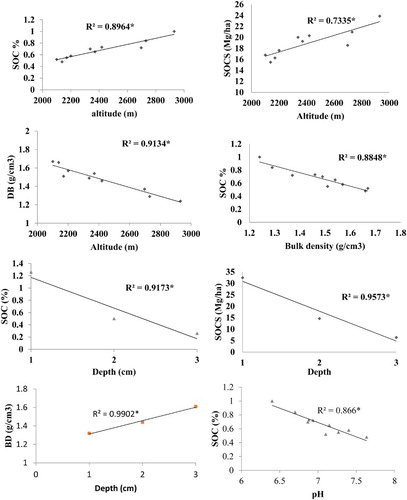
Figure 4. Relationship of soil organic carbon stock with different variable in forest.
Figure 5. Relationship of soil organic carbon stock with different variable in Pasture.