Figures & data
Figure 1. Means and 95% confidence limits of number of shoots in C (control), H1 (early herbicide application), H2 (late herbicide application) and S (Selective cutting) prior to the second treatment (June 2016) and at harvest (September 2016).
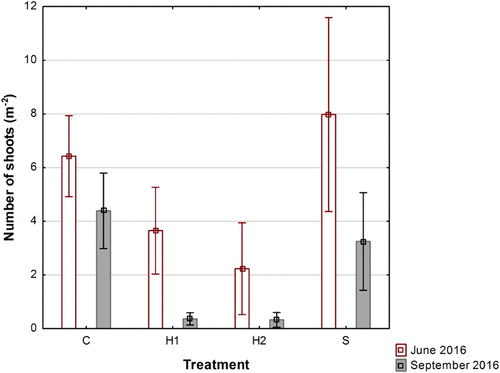
Figure 2. Means and 95% confidence limits of decrease in number of shoots (100 × (NJune-NSeptember)/NSeptember) (%) from June to September 2016 in C (control), H1 (early herbicide application), H2 (late herbicide application) and S (Selective cutting).
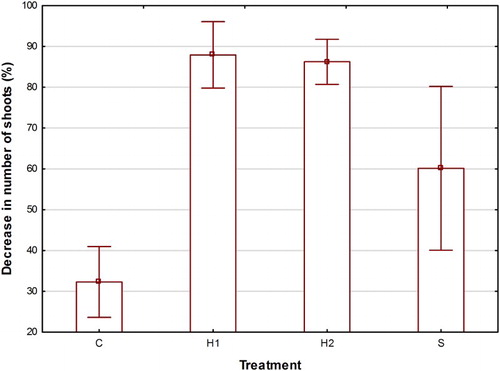
Figure 3. Means and 95% confidence limits of the percentage of shoots which at harvest 2016 had produced seeds in C (control), H1 (early herbicide application), H2 (late herbicide application) and S (Selective cutting).
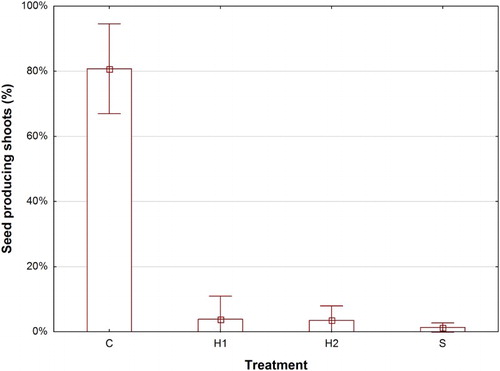
Figure 4. Relation between the number of seeds per flower receptacle and the proportion of rainy days during a 10-day period prior to sampling (r2 = 0.923, P = 0.0388).
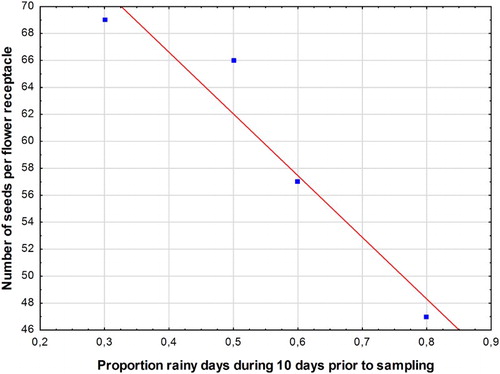
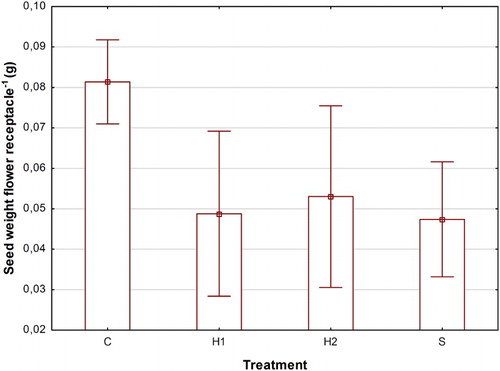
Figure 5. Means and 95% confidence limits of total seed weight per flower receptacle (g) in C (control), H1 (early herbicide application), H2 (late herbicide application) and S (Selective cutting).