Figures & data
Figure 1. DF-share: (a) mounted on a VTH-L/VTH-stem tine (7″ sweep produced by Kongskilde Industries A/S, Denmark), and (b) drawings showing (the clearance share angle) and
(the nose angle).
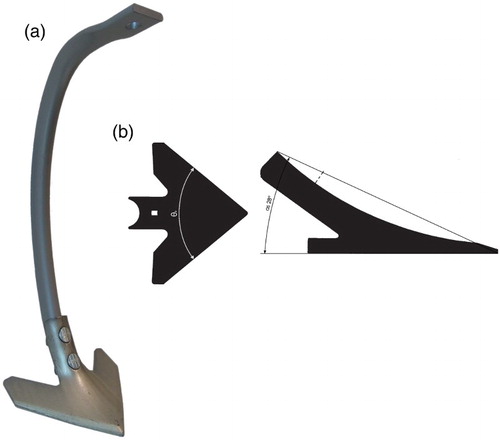
Figure 2. Sweep: (a) drawing (h – the distance between the blade and nose of the sweep, mm) (Author’s certificate SU 1701129 A 1, 1965), and (b) image of a unit produced by Kress Umweltschonende Landtechnik GmbH (KULT), Germany (Agritechnica 2015, Hannover).
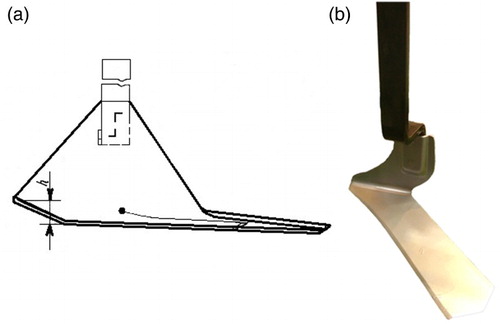
Figure 3. The L-share: (a) image of the L-share mounted on a spring-modified tine and (b) drawing of the L-share.
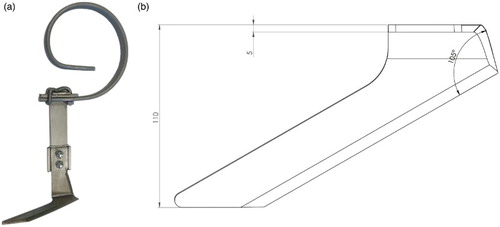
Figure 4. The soil bin facility at the Warsaw University of Life Sciences, Poland: (a) a force transducer, (b) directions of draught forces axes: longitudinal Fx, N – negative values; lateral Fy, N – negative values; vertical Fz, N – positive values; the torque M, Nm around vertical Fz axes – positive values, and c) the soil bin with the axes of the soil movement.
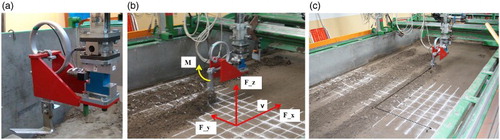
Table 1. Physical properties by weight of the experimental soil.
Figure 5. Placement of cubes with initial coordinates before running the L-share: cubes № 5 x = 40 mm, y = 0; № 4 x = 60 mm, y = 0; № 1 x = 80 mm, y = 0; № 2 x = 100 mm, y = 0; № 3 x = 120 mm, y = 0.
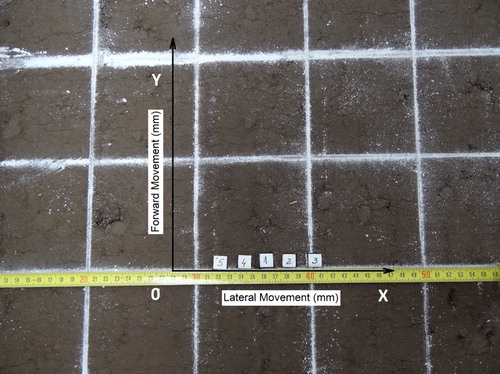
Figure 6. The soil bin with the beams and girder at the Department of Agricultural and Forest Machinery, Faculty of Production Engineering, Warsaw University of Life Sciences, Poland.
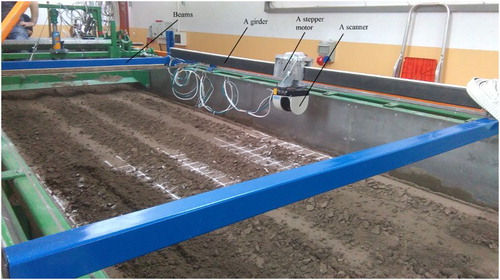
Table 2. Significant main effects of cube number, operation speed and cultivation depth on x and y cube movements, with back-transformed least square means (LSMs) from log-transformation shown for each level of the factors
Table 3. Significant main effects of operation speed and cultivation depth on the draught forces Fx, Fy, and Fz including the inertia M. Least square means (LSMs) are shown for each level of the two factors. LSMs for Fx, Fy and M are back-transformed means from log-transformation, whereas LSM for Fz was from untransformed data
Figure 7. Mean displacements of individual cubes following L-share movements at operation speeds of 0.84, 1.67 and 2.31 m s−1 and cultivation depths of (a) 30 mm, (b) 50 mm and (c) 70 mm.
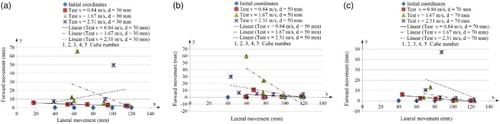
Figure 8. The soil surface following L-share treatments at operation speeds of 2.31 and 0.84 m s−1 respectively and cultivation depth of 30 mm
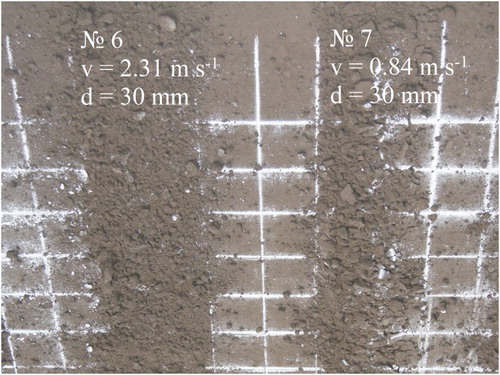
Figure 9. 2D images of the soil profile at a cultivation depth of 30 mm and operation speeds of (a) 2.31 m s−1 and (b) 0.84 m s−1, and of the furrow surface of the soil at a cultivation depth of 30 mm and operation speeds of (c) 2.31 m s−1 and (d) 0.84 m s−1 after L-share treatments.
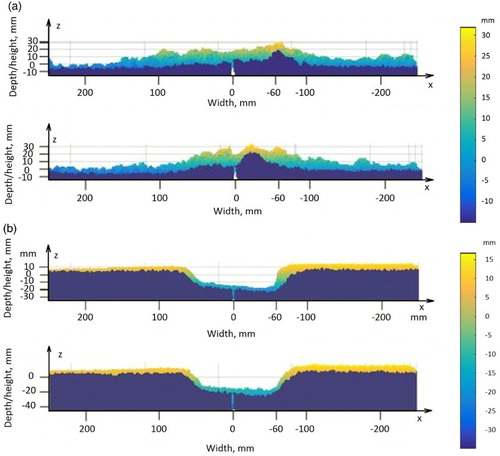
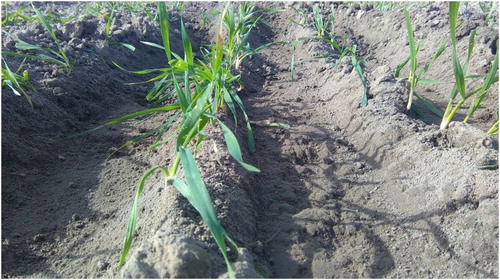
Figure 10. Image of the furrow surface following cultivation with the L-share at 50 mm soil depth and operation speed v = 0.84 m s−1 (field experiment 1 October 2015, Department of Agroecology, Faculty of Science and Technology, Research Center Flakkebjerg, Aarhus University).