Figures & data
Table 1. Weather data of field-cultivated bush tea in Mamelodi, Pretoria, Gauteng Province, South Africa.
Table 2. Chemical characteristics of soils collected from the field experimental site during the 2014–2015 growing season.
Table 3. Response of phytochemical constituents of nitrogen-treated bush tea in a greenhouse environment.
Table 4. Response phytochemical constituents of nitrogen-treated bush tea under field conditions.
Figure 1. Least squares regressions leaf nitrogen against leaf total polyphenols concentration of the bush tea leaves harvested from the greenhouse trial.
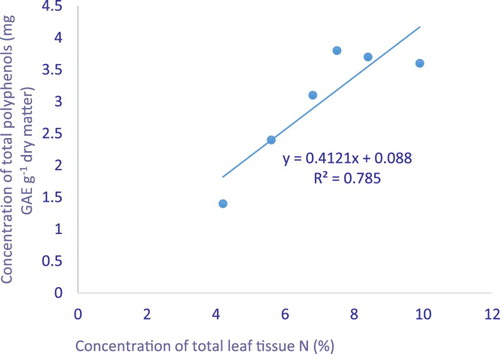
Figure 2. Least squares regressions leaf nitrogen against leaf total polyphenols concentration of the bush tea leaves harvested from the field trial.
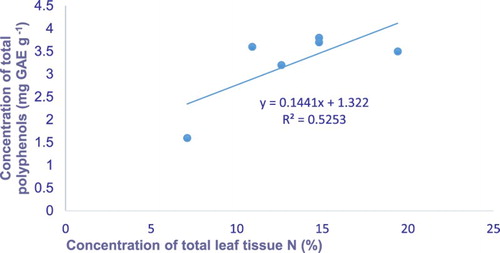
Table 5. Minimum inhibition (MIC) concentration of nitrogen-treated bush tea on selected micro-organisms.
Table 6. Minimum microbicide concentration (MMC) of nitrogen-treated bush tea on selected micro-organisms.
Table 7. Field-harvested bush tea cytotoxicity in relation to nitrogen nutrition.
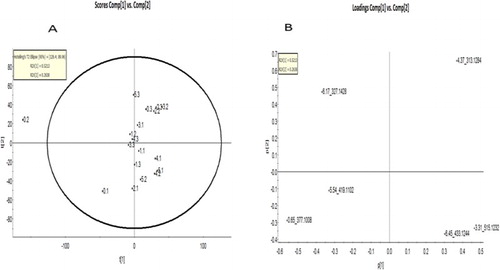
Figure 3. (A) PCA of GC-MS Athrixia phylicoides arboreal samples, (B) Loadings plot of bush tea arboreal samples.
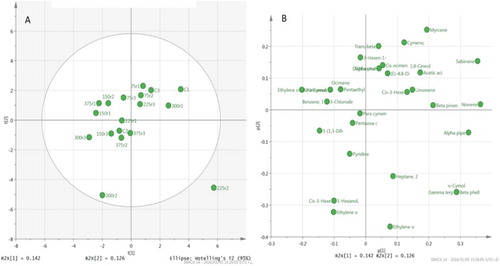
Table 8. Compound detected and concentrations using GC-MS on nitrogen-treated bush tea.
Figure 4. (A) PCA of A. phylicoides arboreal samples run on LC-MS, (B) Loadings plot of the bush tea LC-MS sample.