
Figures & data
Figure 1. Dual culture of Bacillus pumilus WP8 (referred to as WP8) and Ralstonia solanacearum Rs1115 (referred to as RS) showed that these two strains were compatible.
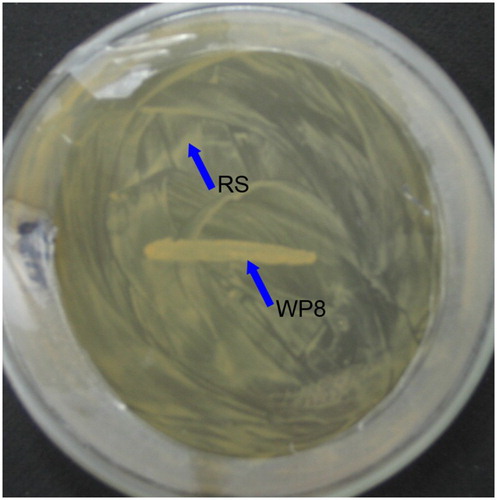
Figure 2. Growth curves of Ralstonia solanacearum Rs1115 in LB broth containing metabolites of Bacillus pumilus WP8 at final concentrations of 20%. 12A and 48A represent primary and secondary metabolites with autoclaving treatment; 12F and 48F represent primary and secondary metabolites with filtration treatment using 0.22 μm filters.
Figure 3. Effects of Bacillus pumilus WP8 on the population of Ralstonia solanacearum Rs1115 in tomato plants. Rs1115: soils were treated with a cell suspension of Rs1115 at a final concentration of 1010 cfu/kg of soil. Rs1115+WP8: plant roots were previously soaked for 30 min in WP8 suspension at a final concentration of 109 cfu/mL.
Table 1. Biocontrol of tomato bacterial wilt and growth-promoting effects mediated by Bacillus pumilus WP8.
Figure 4. Time courses of swarming motility of Ralstonia solanacearum Rs1115 on 0.5% MM semi-solid medium with or without metabolites of WP8. 12F and 48F represent primary and secondary metabolites with filtration treatment using 0.22 μm filters.
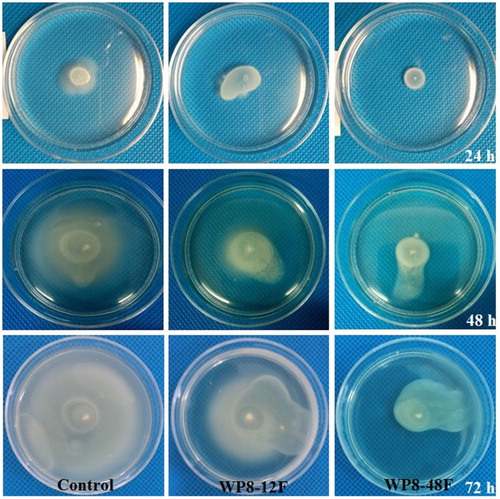
Figure 5. Effects of metabolites of Bacillus pumilus WP8 on twitching motility of Rs1115. 12A and 48A represent primary and secondary metabolites with autoclaving treatment; 12F and 48F represent primary and secondary metabolites with filtration treatment using 0.22 μm filters.
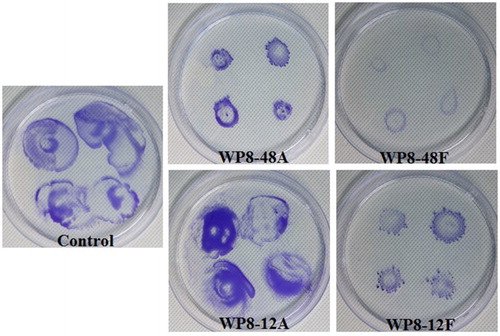
Figure 6. Time course of Ralstonia solanacearum Rs1115 spreading formed on MM plates. Different lengths of edges of colonies indicate distinct abilities to exhibit twitching motility.
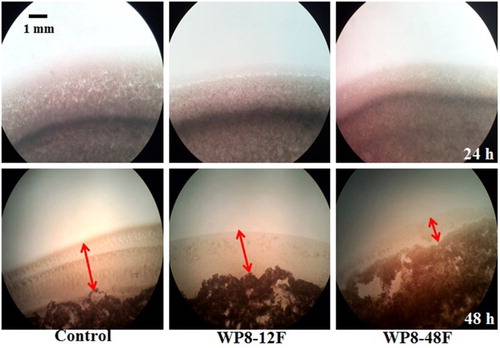
Figure 7. Expression analysis of Ralstonia solanacearum Rs1115 genes involved in virulence. Data represent the mean expression ± standard deviation of three independent experiments. Single asterisk (*) and double asterisks (**) indicate significant differential expression of genes versus controls at P < 0.05 and P < 0.01 respectively, according to the Duncan test.
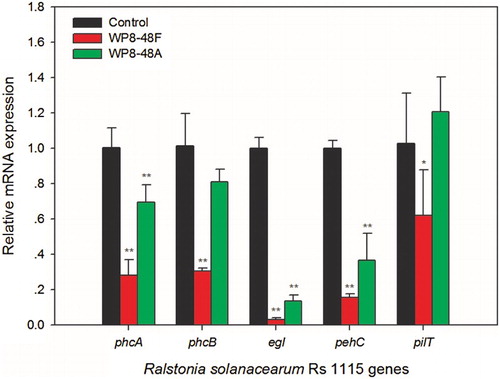
Table 2. Effects of metabolites of Bacillus pumilus WP8 on swimming motility of Ralstonia solanacearum Rs1115.
Table 3. Effects of metabolites of Bacillus pumilus WP8 on twitching motility of Ralstonia solanacearum Rs1115.
Table 4. Effects of metabolites of Bacillus pumilus WP8 on twitching motility of Ralstonia solanacearum Rs1115.
Figure 8. Time course of two typical defense enzymes activities [peroxidase (POD) and phenylalanine ammonia-lyase (PAL)].
![Figure 8. Time course of two typical defense enzymes activities [peroxidase (POD) and phenylalanine ammonia-lyase (PAL)].](/cms/asset/ad72e773-68b3-4dea-8a14-ae414e9fa6c6/sagb_a_1416663_f0008_b.gif)