Figures & data
Table 1. Detailed work schedule of salinity application.
Table 2. Effect of different potassium sulphate (K2SO4) doses on plant height (cm), fresh and dry herb (g plant–1), fresh and dry leaf (g plant–1) of evaluated plants under salinity and control conditions.
Table 3. Effect of different potassium sulphate (K2SO4) doses on fresh and dry shoot (g plant–1), fresh dry root (g plant–1) and root length (cm) of evaluated plants under salinity and control conditions.
Figure 1. Concentration of Na+ in evaluated plants (mg kg−1) by increasing K2SO4 doses under salinity and control conditions.
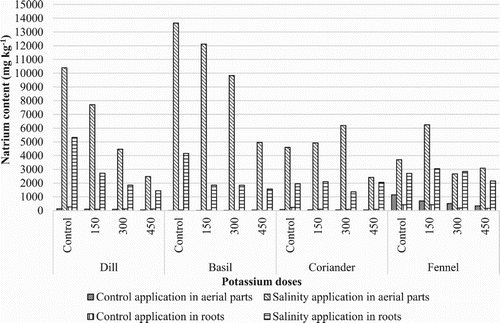
Figure 2. Concentration of Cl− in evaluated plants (mg kg−1) by increasing K2SO4 doses under salinity and control conditions.
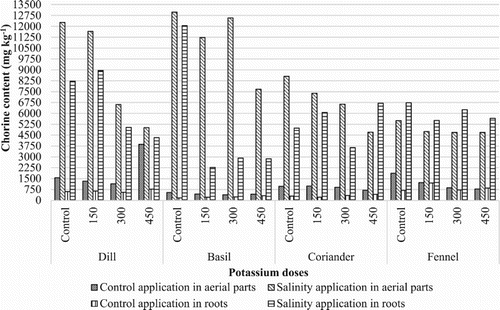
Table 4. Salinity and pH values of growth media of different potassium levels and salinity and control conditions.
Figure 3. Concentration of Ca+2 in evaluated plants (mg kg−1) by increasing K2SO4 doses under salinity and control conditions.
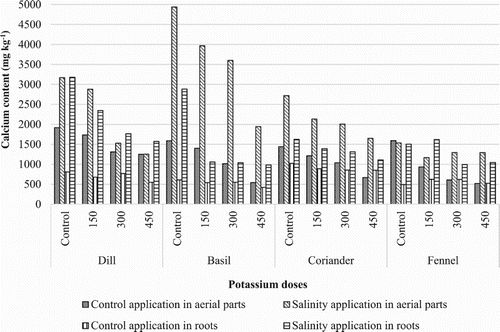
Figure 4. Concentration of K+ in evaluated plants (mg kg−1) by increasing K2SO4 doses under salinity and control conditions.
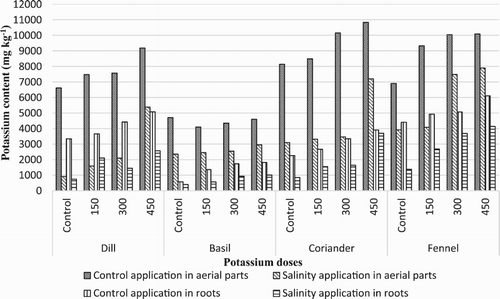
Figure 5. Concentration of Mg+2 in evaluated plants (mg kg−1) by increasing K2SO4 doses under salinity and control conditions.
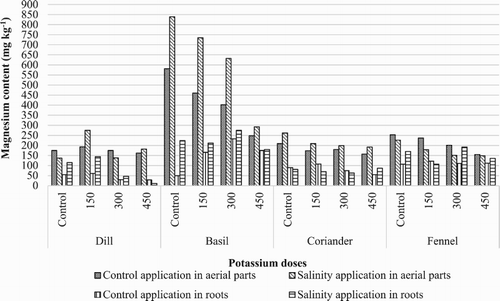
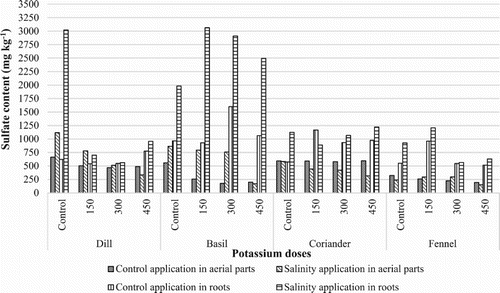
Figure 6. Concentration of in evaluated plants (mg kg−1) by increasing K2SO4 doses under salinity and control conditions.