Figures & data
Table 1. The Soil chemical and physical properties of the sampling site in experiment.
Figure 1. SEM micrograph of root surface in Panax ginseng. (A) SEM micrograph before root surface sterilisation. Bar = 100 μm. (B) SEM micrograph after root surface sterilisation. No bacteria was detected on the root surface. Bar = 100 μm. (C) SEM micrograph before root surface sterilisation. Many bacteria were adhered to the root surface. Bar = 1 μm. (D) SEM micrograph after root surface sterilisation. Bar = 1 μm.
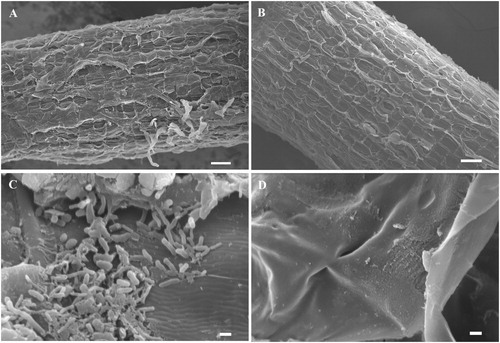
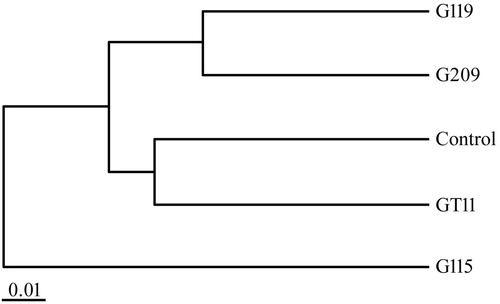
Figure 2. Phylogenetic tree of the PGPB strains isolated from the Panax ginseng based on the sequences of the 16S rRNA gene. “▴” represented the strains isolated in present study along with related sequences of type strain closely obtain from GenBank. The bootstrap was 1000 iterations and the value ≥ 50 were shown at the branching point. The bar indicated sequence divergence of 0.1 nucleotides.
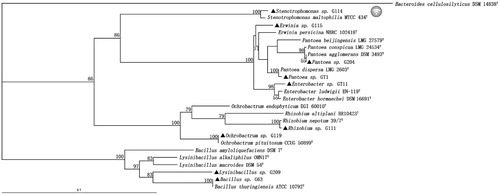
Table 2. Promoting growth properties of bacteria isolated from Panax ginseng.
Figure 3. Effect of plant growth promoting bacteria on growth characteristics in Panax ginseng. Plant height (A), root length (B), fresh weight (C) and dry weight (D) were measured respectively in the non-inoculated (control) and inoculated plantlets. The experiments were repeated twice and 10 plants per set. Values are means ± standard deviation. Different letters denote significant differences (p < .05) comparison between treatments by Duncan’s test.
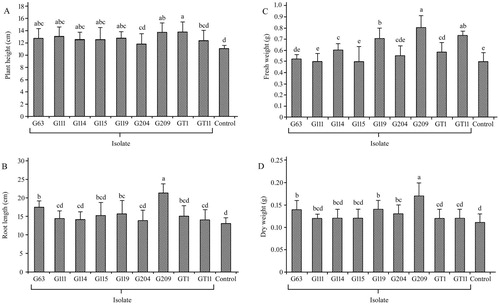
Figure 4. Effect of plant growth promoting bacteria on root activity in Panax ginseng. The experiments were repeated twice and 10 plants per set. Values are means±standard deviation. Different letters denote significant differences (p < .05) comparison between treatments based on a one-way ANOVA by Duncan’s test.
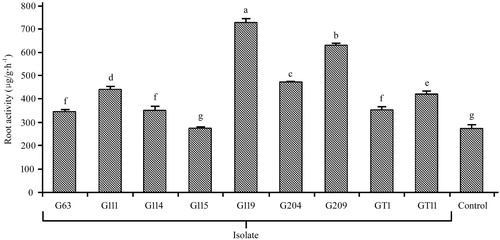
Figure 5. Effect of plant growth promoting bacteria on ginsenoside in Panax ginseng. (A) The Chromatogram of ginsenosides of control treatment by HPLC. (B) The Chromatogram of ginsenosides of G209 by HPLC. (C) The content of monomer and total ginsenoside. The experiments were repeated twice and 10 plants per set. Values are means±standard deviation. Different letters denote significant differences (p < .05) comparison between treatments based on a one-way ANOVA by Duncan’s test.
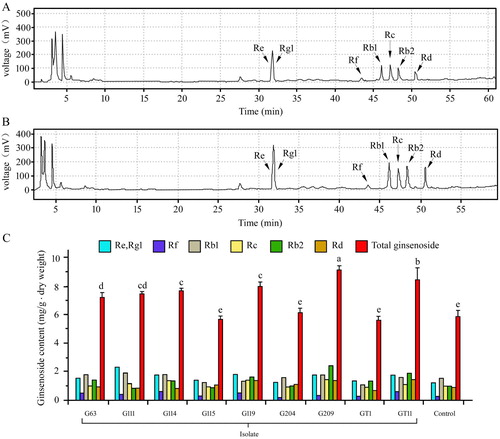
Figure 6. Relative abundances of the dominant bacterial phyla in ginseng rhizospheric soils inoculated plant growth promoting bacteria and non-inoculated control. The experiments were repeated triple and 10 plants per set.
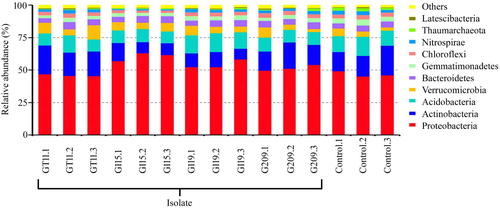
Figure 7. Effect of plant growth promoting bacteria inoculation on relative abundance of beneficial bacteria in ginseng rhizosphere. Values are means ± standard deviation. “*” denote significant differences (p < .05) comparison different inoculated treatment with PGPB and non-inoculated control by Duncan’s test.
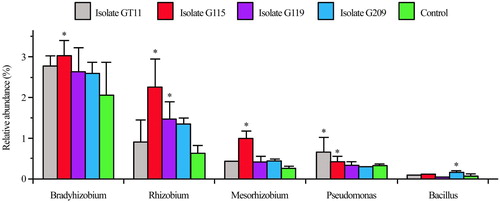
Figure 8. Effect of plant growth promoting bacteria on distribution and clustering of ginseng rhizospheric bacteria community based on Non-metric Multi-dimensional Scaling analysis.
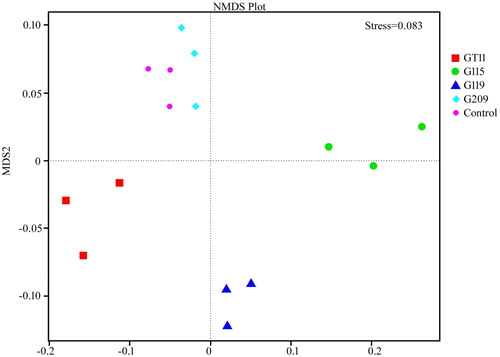
Figure 9. Clustering analysis on bacterial community of different PGPB inoculation of ginseng based on weighted unifrac distance.