Figures & data
Table 1. Crop rotation land management and manuring of arable farming types in conventional (C) and organic (O) systems at the three sites of Karcag (K), Martonvásár (M) and Nyíregyháza (Ny) four years before sampling.
Figure 1. Principal components (PCA) biplot analysis among the soil samples (Karcag, Martonvásár and Nyíregyháza) from conventional and organic farming systems. (Legends: C = conventional, O = organic systems, K = Karcag, M = Martonvásár, Ny = Nyíregyháza, n = 12, except KC, MC, MO, NYC n = 11 were used, filled circle = KC, circle = KO, filled triangle = MC, triangle = MO, filled square = NyC, square = NyO).
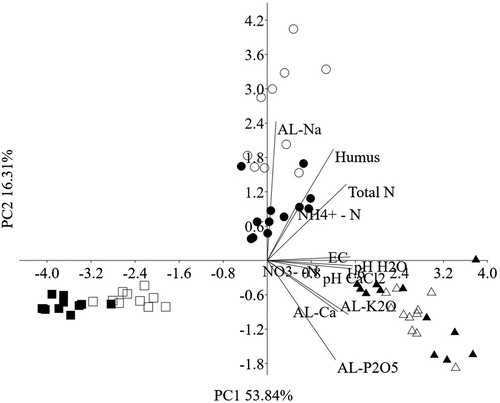
Table 2. The main soil physical properties from conventional and organic farming systems in the three sampling sites.
Table 3. The main soil chemical parameters originated from three different soil types with conventional and organic farming systems.
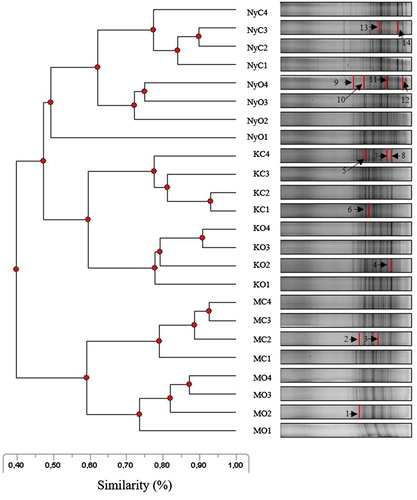
Figure 2. The banding pattern of the DGGE UPGMA dendrogram of bacterial communities. (Legends: C = conventional, O = organic systems, K = Karcag, M = Martonvásár, Ny = Nyíregyháza, the codes of farming systems with numbering 1–4 indicated the soil samples (n = 4) which best represent the above area. Numbers in the banding patterns 1–14 indicated the isolated and sequenced bands (thick lines)).