Figures & data
Figure 1. Visible effects of silver nanoparticles (AgNPs) on tulip growth attributes. Left to right: 0 (control), 25, 50, 100 and 150 mg L−1 AgNPs.
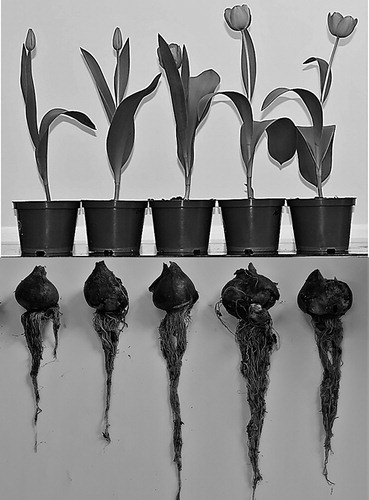
Table 1. Impacts of silver nanoparticles’ (AgNPs) various concentrations on flowering of tulip in two seasons.
Figure 2. Impacts of silver nanoparticles’ (AgNPs) various concentrations on the leaf greenness index of tulip in seasons 2014–2015 (A) and 2015–2016 (B). Vertical bars indicate the mean ± standard deviation (n = 4). A different letter above each bar indicates a significant difference between treatments at P ≤ 0.05.
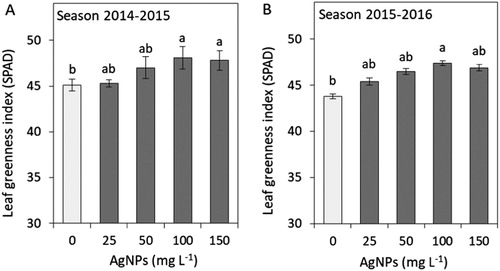
Figure 3. Impacts of silver nanoparticles’ (AgNPs) various concentrations on stomatal conductance of tulip in seasons 2014–2015 (A) and 2015–2016 (B). Vertical bars indicate the mean ± standard deviation (n = 4). A different letter above each bar indicates a significant difference between treatments at P ≤ 0.05.
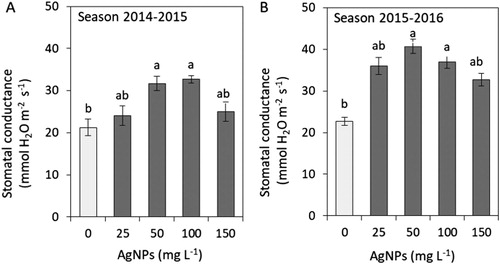
Figure 4. Impacts of silver nanoparticles’ (AgNPs) various concentrations on the root fresh weight of tulip in seasons 2014–2015 (A) and 2015–2016 (B). Vertical bars indicate the mean ± standard deviation (n = 4). A different letter above each bar indicates a significant difference between treatments at P ≤ 0.05.
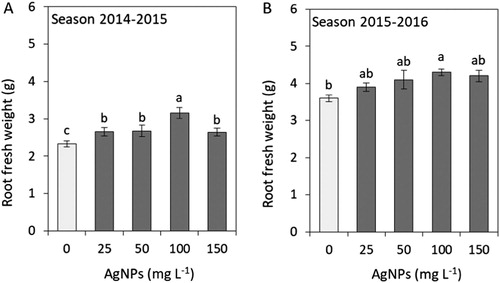
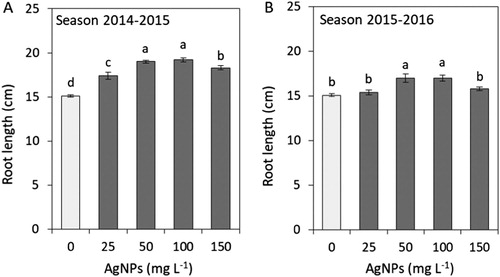
Figure 5. Impacts of silver nanoparticles’ (AgNPs) various concentrations on root length of tulip in seasons 2014–2015 (A) and 2015–2016 (B). Vertical bars indicate the mean ± standard deviation (n = 4). A different letter above each bar indicates a significant difference between treatments at P ≤ 0.05.