Figures & data
Figure 1. Mean monthly (a) temperature, and (b) total precipitation during the study period (October 2016 to May 2017).
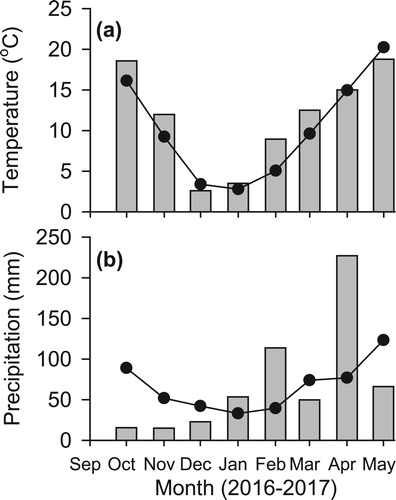
Figure 2. Soil respiration fluxes from paired paddocks of (a) dual-purpose winter wheat, (b) graze-only winter wheat, (c) grain-only winter wheat, and (d) canola under reduced (closed markers) and conventional (open markers) tillage systems. Data represent average and standard error of soil respiration fluxes measured at eight cores (n = 8). Significance levels (P-values) of two-way analysis of tillage treatment (T), measurement date (D), and interaction effects (T × D) are presented. ***P < .001; **P < .01; *P < .05; ns, non-significant (P > .05).
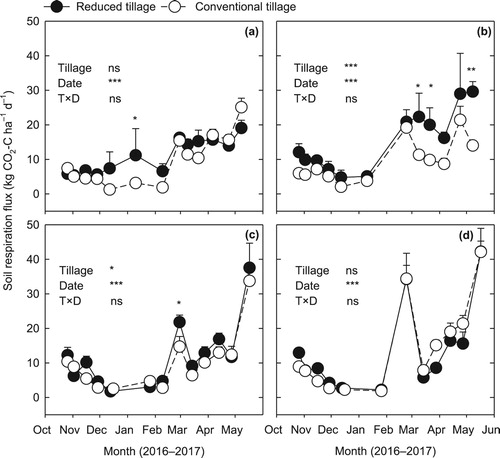
Figure 3. Correlations of soil respiration flux with soil temperature and volumetric water content at 0–5 cm soil depths for (a) dual-purpose winter wheat, (b) graze-only winter wheat, (c) grain-only winter wheat, and (d) canola under reduced (closed markers) and conventional (open markers) tillage systems. The data points represent average of eight (n = 8) measurements in an individual date. The lines represent linear fits (solid lines for reduced tillage and dashed lines for conventional tillage systems). Coefficient of determination (R2) of linear fits is shown. The R2 values in bold indicate significant (P < .05) linear fit.
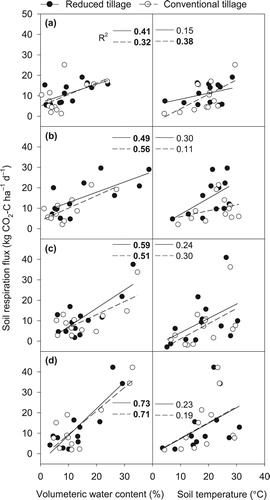
Figure 4. Average and standard errors (n = 8) of soil respiration fluxes. Letters above bars represent mean separation (P < .05) between two paired tillage treatments under individual cropping systems.
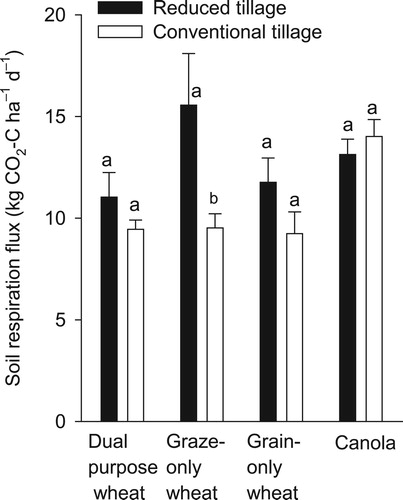
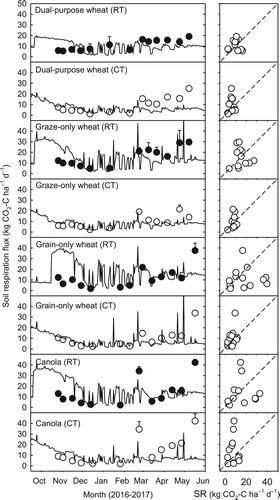
Figure 5. Left panels: Comparison between simulated daily soil respirations by the DNDC model (lines) and measured fluxes (markers) from eight individual fluxes. Error bars for measured fluxes are standard deviation (n = 8). Right panels: 1:1 comparison between the modelled (x-axis) and measured (y-axis) soil respiration fluxes.