Figures & data
Table 1. List of cowpea accessions used in the study.
Table 2. Analysis of variance showing mean square values and significance test of agronomic traits among cowpea genotypes in different sites during 2017/18 season.
Figure 1. Correlation coefficient matrix showing associations of agronomic traits among cowpea genotypes evaluated across two environments. DTF, days to flowering; BRN, number of branches; PNP, pod number per plant; PWP, pod weight per plant; HSW, hundred seed weight; SPD, seed number per pod; SNP, seed number per plant; GY, grain yield.
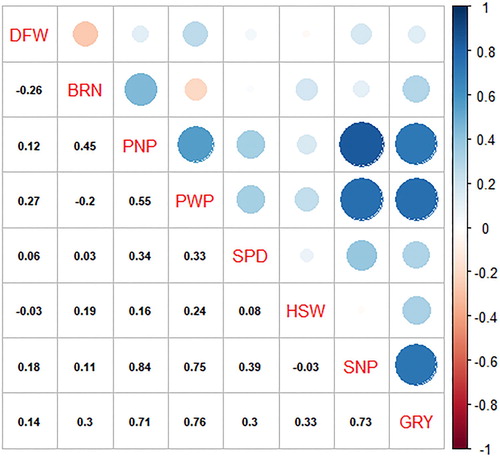
Table 3. Direct (diagonal and bold font) and indirect (off-diagonal) path coefficient values of agronomic traits in cowpea.
Table 4. Principal component analysis showing eigenvectors, percent and cumulative variation of agronomic traits among 100 cowpea genotypes.
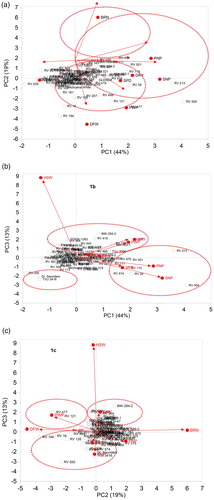
Figure 2. Bi-plots of principal components showing % variation accounted for PC1 vs. PC2, PC1 vs. PC3 and PC2 vs. PC3 and relationships among cowpea genotypes and agronomic traits based on combined data across test environments. DFW, days to flowering; BRN, number of branches; PNP, pod number per plant; PWP, pod weight per plant; SPD, seed number per pod; HSW, hundred seed weight; SNP, seed number per plant; GRY, grain yield.