
Figures & data
Table 1. Bambara groundnut genotypes used in the study.
Table 2. Initial physio-chemical properties of soil at Ligala in Siaya County, Kenya.
Table 3. Mean values of plant biomass, grain yield and biological yield for 12 Bambara genotypes grown in low and adequate P during long and short rain seasons in the year 2018 at Ligala.
Table 4. Mean values of phosphorus accumulation in plant biomass, grain and index scores of 12 Bambara genotypes grown at low and adequate P at Ligala in Siaya, Kenya.
Table 5. Pearson correlation matrix showing relationship between total phosphorus accumulation and grain yield, plant biomass and biological yield for 12 Bambara genotypes at low and adequate P.
Table 6. Mean values of phosphorus efficiency indices of 12 Bambara genotypes grown at low and adequate P supply.
Table 7. Classification of 12 Bambara genotypes within three performance levels based on total index scores of grown at low and adequate P.
Figure 1. Distribution of 12 Bambara genotypes based on their grain yield and total P accumulation at low P. LGY = Low grain yield, MGY = Medium grain yield, HGY = High grain yield, LP = Low Phosphorus, MP = Medium Phosphorus, HP = High Phosphorus. Numbers in figure represent names of genotypes studied in the experiment as 1 = BAM001, 2 = BAM002, 3 = BAM003, BAM = 004, 5 = BAM005, 6 = BAM006, 7 = BAM007, 8 = BAM008, 9 = BAM010, 10 = BAM010, 11 = BAM011, 12 = BAM012.
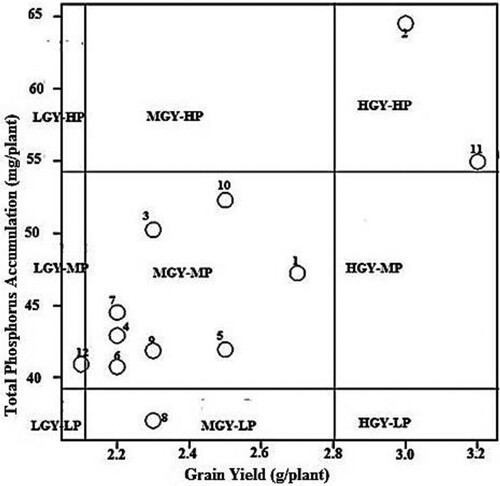
Figure 2. Distribution of 12 Bambara genotypes based on their grain yield and total P accumulation at adequate P. LGY = Low grain yield, MGY = Medium grain yield, HGY = High grain yield, LP = Low Phosphorus, MP = Medium Phosphorus, HP = High Phosphorus. Numbers in figure represent names of genotypes studied in the experiment as 1 = BAM001, 2 = BAM002, 3 = BAM003, BAM = 004, 5 = BAM005, 6 = BAM006, 7 = BAM007, 8 = BAM008, 9 = BAM010, 10 = BAM010, 11 = BAM011, 12 = BAM012.
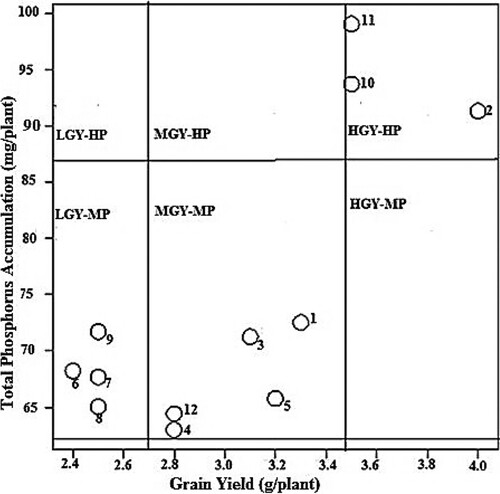
Figure 3. Principal component analysis biplot of yield, phosphorus accumulation and phosphorus efficiency indices of 12 bambara genotypes grown at low P. PHI = Phosphorus Harvest Index, PPEI = Phosphorus Physiological Efficiency Index, PBER = Phosphorus Biological Efficiency Ratio. Numbers in figure represent genotypes as follows: 1 = BAM001, 2 = BAM002, 3 = BAM003, BAM = 004, 5 = BAM005, 6 = BAM006, 7 = BAM007, 8 = BAM008, 9 = BAM010, 10 = BAM010, 11 = BAM011, 12 = BAM012.
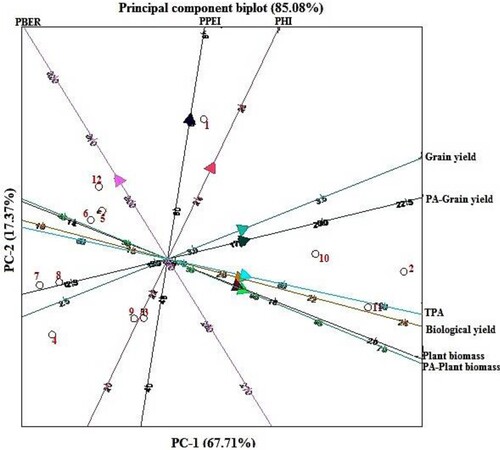
Figure 4. Bi-plot of principal components showing percent variation accounted for PC1 vs. PC2 and relationships among 12 bambara genotypes based on yield, phosphorus accumulation and phosphorus efficiency indices grown at adequate P. PHI = Phosphorus harvest index, PPEI = Phosphorus physiological efficiency index, PBER = Phosphorus biological efficiency ratio. Numbers in figure represent genotypes as follows: 1 = BAM001, 2 = BAM002, 3 = BAM003, BAM = 004, 5 = BAM005, 6 = BAM006, 7 = BAM007, 8 = BAM008, 9 = BAM010, 10 = BAM010, 11 = BAM011, 12 = BAM012.
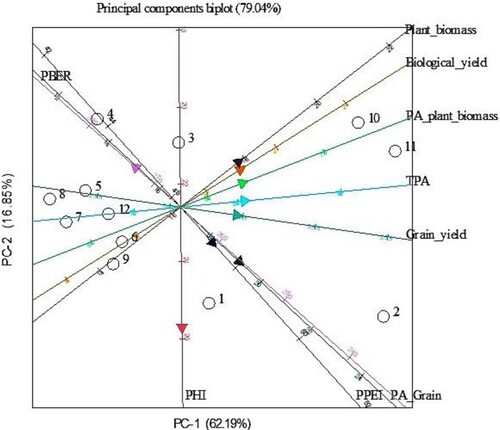
Table 8. Principal component analysis showing eigenvectors, percent and cumulative variation of yield, phosphorus accumulation and phosphorus efficiency indices of 12 bambara genotypes grown under low and adequate P.