Figures & data
Table 1. Experimental peat-biochar mixtures with different substitution ratios of peat by hardwood biochar.
Figure 1. The grading curve of fractional content of biochar. Percentage ratio of fractional mass retained for each fractional diameter in logarithmic scale.
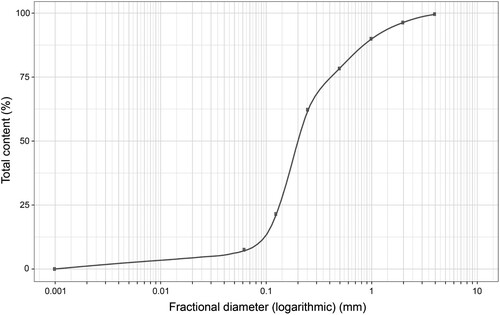
Figure 2. Effect of peat substitution by biochar on initial and final (a) pHKCl and (b) electrical conductivity (mS m−1) (mean ± standard error). Different letters indicate different groups according to Tukey HSD test (α = 0.05), lower case for differences among treatments for initial pH and EC, upper case for differences among treatments for final pH and EC. Stars indicate significant differences between initial and final for each treatment according Wilcoxon signed-rank test (p < .05).
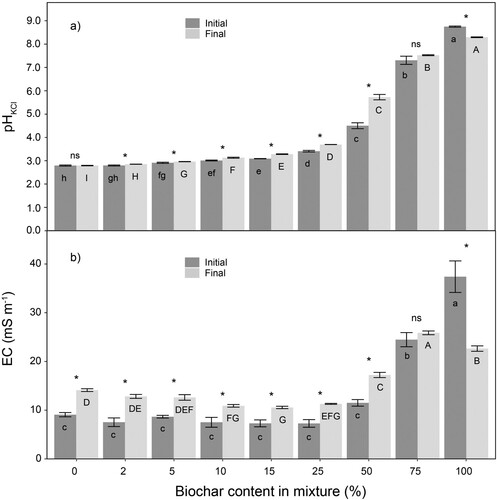
Table 2. The total content of nutrients in the different treatments in the end of the experiment.
Table 3. The content of available nutrients in the different treatments in the end of the experiment.
Figure 3. Effect of peat substitution by biochar on final germination percentage (%) of Tagetes patula seeds (mean ± standard error). Different letters indicate different groups according to Dunn test (α = 0.05).
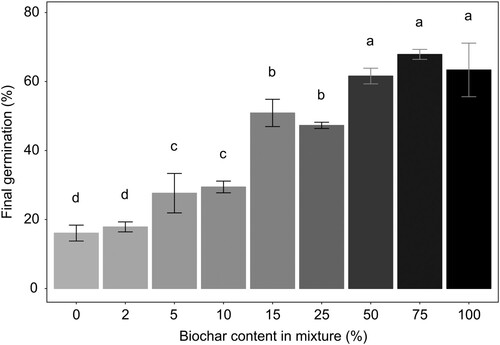
Figure 4. Correlation analysis (Pearson’s correlation coefficient, r) between germination (%), plant growth parameters and growing media characteristics (pHKCl, EC, available P, K, Ca and Mg). Black colour indicates positive and grey colour negative correlation; asterisks indicate statistically significant correlations (p < .05).
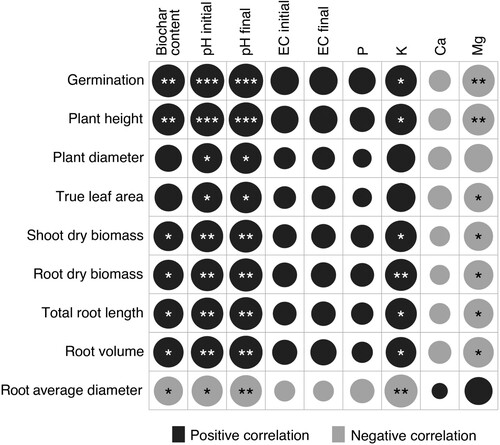
Figure 5. Effect of peat substitution by biochar on (a) plant height (mm), (b) plant diameter (mm), (c) shoot dry biomass (g plant−1) and (d) true leaf area (mm2 plant−1) of Tagetes patula. Grey dot represents the mean. Different letters indicate different groups according to Dunn test (α = 0.05).
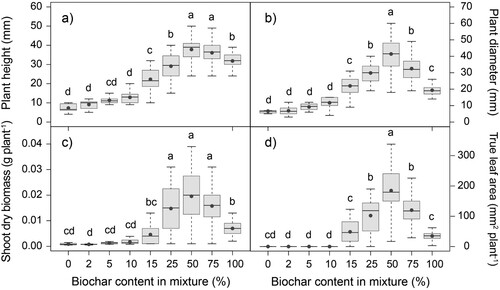
Figure 6. Effect of peat substitution by biochar on (a) root dry biomass (g plant−1), (b) total root length (cm plant−1), (c) root volume (cm3 plant−1) and (d) root average diameter (mm) of Tagetes patula (mean ± standard error). Grey dot represents the mean. Different letters indicate different groups according to Dunn test (α = 0.05).
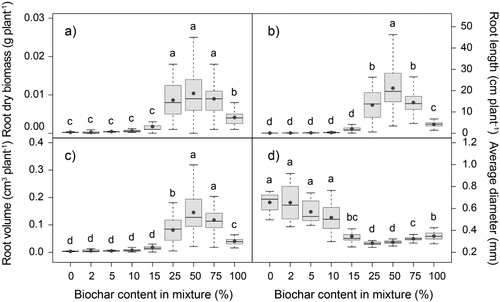
Table 4. Effect of peat substitution by biochar on the nutrient content in plant shoots.
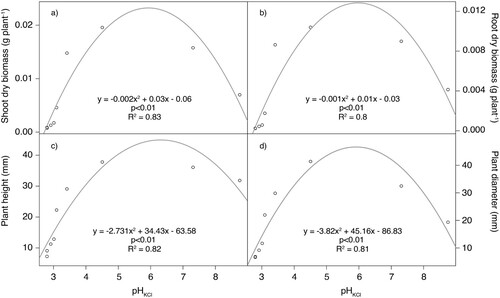
Figure 7. Quadratic regression between pH and (a) shoot dry biomass, (b) root dry biomass, (c) plant height and (d) plant diameter.